如何在gnuplot中设置stats函数的范围?

3

我有一系列的时间序列数据,如下所示,我想要绘制所有数据,以及特定范围(例如3、6或9个月)的平均值。

    Time           T      D      T/D
    8/1/2021    1785.28 23.99   74.42
    7/1/2021    1807.84 25.68   70.40
    6/1/2021    1834.57 27  67.95
    5/1/2021    1850.26 27.5    67.28
    4/1/2021    1760.04 25.69   68.51
    3/1/2021    1718.23 25.65   66.99
    2/1/2021    1808.17 27.29   66.26
    1/1/2021    1866.98 25.88   72.14
    12/1/2020   1858.42 24.97   74.43
    11/1/2020   1866.3  24.08   77.50
    10/1/2020   1900.27 24.23   78.43
    9/1/2020    1921.92 25.74   74.67
    8/1/2020    1968.63 27  72.91

我正在使用gnuplot 5.2,并尝试使用以下代码进行绘图,但似乎统计数据未按我预期的工作。
  # plot data vs date 
    
    reset session
    
    FILE = "data_01.dat"

    set timefmt "%m/%d/%Y"
    stats ["8/1/2020":"1/1/2021"] FILE u 4 name "A"
    stats ["8/1/2020":"8/1/2021"] FILE u 4 name "B"

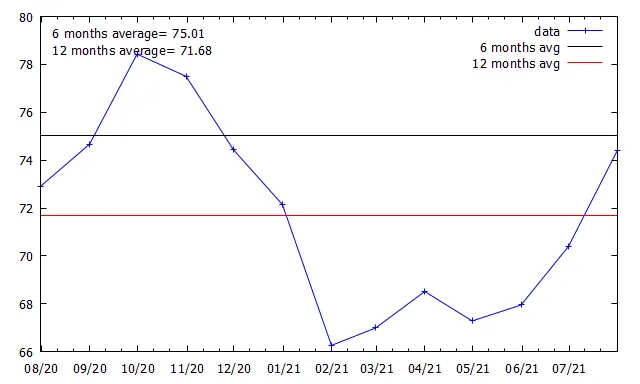
    set label 1  sprintf("6 months average= %.2f",A_mean) at graph 0.02, graph 0.95
    set label 2  sprintf("12 months average= %.2f",B_mean) at graph 0.02, graph 0.90

    set xdata time
    set format x "%m/%y"
    set xrange ["8/1/2020":"8/1/2021"]
    
    plot FILE u 1:4 skip 1 w lp lc rgb 'blue' t 'data' ,\
    A_mean lc rgb 'black' t '6 months avg',\
    B_mean lc rgb 'red' t '12 months avg'
    
  # end of code

我得到的输出如下所示: data_plot 我认为我在设置统计数据的范围时犯了错误,导致统计数据计算整个列的平均值而不是特定范围内的平均值。但我找不到如何修复它。起初我尝试使用以下方法:
stats ["8/1/2020":"1/1/2021"] FILE u (timecolumn(1)):4 name "A"

但它没有给我任何输出,并以“undefined variable: A_mean”结束。 如何在gnuplot中正确设置stats函数的范围?

欢迎来到SO!在您的“stats”命令的“using”部分中有一个小错误,它应该说“using 1:4”-否则行号将被用作x。据我理解,“set xdata time”应该在“stats”之前执行。然而,这会引发错误“timedata模式下不可用的Stats命令”,因此对我来说解决方案并不简单... - Eldrad
2个回答

1

似乎在gnuplot中,至少在5.5版本中,无法在stats中使用timedata,我找到了一种基于gnuplot: xdata time & calculations的(丑陋的)解决方法,它将输入的时间和范围定义转换为从1970年1月1日起的秒数,比较输入值是否大于下限并小于上限;如果是,则返回实际的y值,否则返回NaN,然后被stats忽略。

reset session
fmt="%m/%d/%Y"      #shortcut for the format string

FILE = "data_01.dat"
stats FILE u 1:(strptime(fmt,stringcolumn(1)) >= strptime(fmt,"8/1/2020") && strptime(fmt,stringcolumn(1)) <= strptime(fmt,"1/1/2021") ? $4 : NaN) name "A"

功能解释: strptime 将按照第一个参数格式化的时间字符串(第二个参数)转换为UNIX时间。因此,从文件中读取的x值需要处理为字符串。 $1 提供的是数字而不是字符串,因此必须使用 stringcolumn。通过这种方式,您可以获得y列的平均值,该平均值存储为A_mean_y(请注意'_y'!)。但也许有人比我有更优雅的解决方案...

谢谢,@Eldrad!我明白stats不能与时间数据一起使用,这就是为什么我在stats之后放置了set xdata time。但我没有意识到我需要在stats中使用strptime才能与stringcolumn一起使用。感谢您清晰的解释,包括A_mean_y! - Agung

1
基本上,Eldrad已经提到了所有的要点...当我还在编程时... stats不能使用时间数据,即set xdata time。此外,如果您想限制第一个日期列,您也必须在stats中使用第1列。检查修改后的代码,它将给出合理的结果。
编辑:不要多次使用strptime(myTimeFmt,"8/1/2020"),您还可以定义一个函数myTime(s) = strptime(myTimeFmt,s),这样可以缩短一些内容,并且不会看起来那么“恐怖”。
代码:
# plot data vs date and using stats 
reset session

$Data <<EOD
Time           T      D      T/D
8/1/2021    1785.28 23.99   74.42
7/1/2021    1807.84 25.68   70.40
6/1/2021    1834.57 27  67.95
5/1/2021    1850.26 27.5    67.28
4/1/2021    1760.04 25.69   68.51
3/1/2021    1718.23 25.65   66.99
2/1/2021    1808.17 27.29   66.26
1/1/2021    1866.98 25.88   72.14
12/1/2020   1858.42 24.97   74.43
11/1/2020   1866.3  24.08   77.50
10/1/2020   1900.27 24.23   78.43
9/1/2020    1921.92 25.74   74.67
8/1/2020    1968.63 27  72.91
EOD

myTimeFmt = "%m/%d/%Y"
set timefmt myTimeFmt
myTime(s) = strptime(myTimeFmt,s)

stats [myTime("8/1/2020"):myTime("1/1/2021")] $Data u (timecolumn(1)):4 name "A" nooutput
stats [myTime("8/1/2020"):myTime("8/1/2021")] $Data u (timecolumn(1)):4 name "B" nooutput

set label 1  sprintf("6 months average= %.2f",A_mean_y) at graph 0.02, graph 0.95
set label 2  sprintf("12 months average= %.2f",B_mean_y) at graph 0.02, graph 0.90

set format x "%m/%y" time
set xrange [myTime("8/1/2020"):myTime("8/1/2021")]

plot $Data u (timecolumn(1)):4 skip 1 w lp lc rgb 'blue' t 'data' ,\
     A_mean_y lc rgb 'black' t '6 months avg',\
     B_mean_y lc rgb 'red'   t '12 months avg'
### end of code

结果:

enter image description here


谢谢,@theozh,你的代码让我更好地理解了如何限制这种类型数据的stats。我原本以为设置timefmt可以直接用于限制范围,就像我代码中的set xrange一样,虽然对绘图有效,但对stats无效。 - Agung
@Agung 不用谢。据我了解,如果你在“stats”命令中写入“using 4”,它将尝试在你的时间限制内限制你的第4列,这是不匹配的。 - theozh
@theozh 啊,这绝对是一个比我的方法更直接或者说更“干净”的解决方案,我一直在苦恼所有这些时间函数……无论如何,在“stats”中使用4与在“plot”中的解释是一样的,也就是说,行号被视为x轴(当然不匹配时间范围)。换句话说,它是“using 0:4”的同义词。 - Eldrad

网页内容由stack overflow 提供, 点击上面的
可以查看英文原文,
原文链接