强制非零y截距的线性回归

3

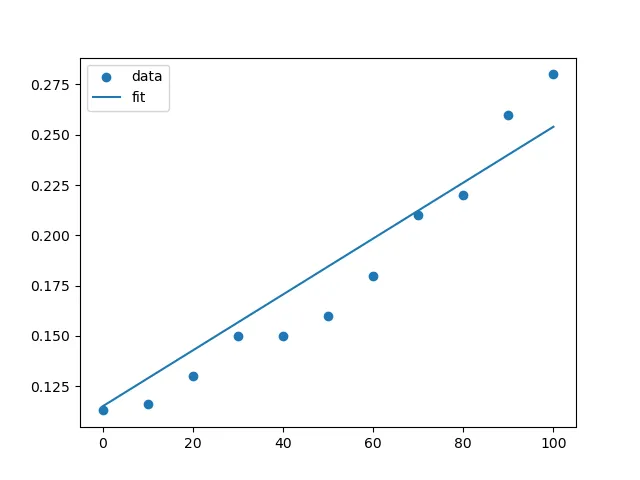
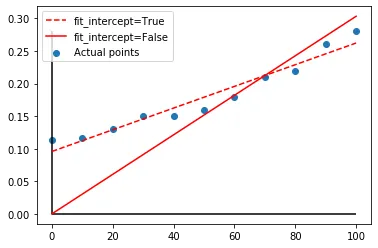
我希望进行一次线性回归,其中y截距被强制设为0.115。这是我尝试的代码。我设置fit_intercept=True以获得一个非零的y截距,但我能将其设置为一个值吗?

另外,我如何绘制最佳拟合直线,而不是连接每个点的直线?

提前感谢。

import numpy as np
import matplotlib.pyplot as plt
from scipy.optimize import curve_fit
from sklearn.metrics import r2_score
from sklearn.linear_model import LinearRegression
x=np.array([0, 10, 20, 30, 40, 50, 60, 70, 80, 90, 100]).reshape(-1,1)
y=np.array([0.113, 0.116, 0.130, 0.150, 0.150, 0.160, 0.180, 0.210, 0.220, 0.260, 0.280])
regression=LinearRegression(fit_intercept=True).fit(x,y)
r_sq=round(regression.score(x,y),4)
m=round(regression.coef_[0],4)
b=round(regression.intercept_,4)
print("r_sq:", r_sq,"m:",m,"b:",b)
plt.figure()
plt.scatter(x,y)
plt.title('A')
plt.ylabel('X')
plt.xlabel('Y')
plt.plot(x,y,'r--',label='measured')
plt.legend(loc='best')
4个回答

3

从您要修正的y截距中减去数据,然后将fit_intercept=False

例如:

import matplotlib.pyplot as plt
import numpy as np
from sklearn.linear_model import LinearRegression

x = np.array([0, 10, 20, 30, 40, 50, 60, 70, 80, 90, 100]).reshape(-1, 1)
y = np.array([0.113, 0.116, 0.130, 0.150, 0.150, 0.160, 0.180, 0.210, 0.220, 0.260, 0.280])

fig, ax = plt.subplots()

for fit, y_intercept in zip((True, False), (0.0, 0.115)):
    regression = LinearRegression(fit_intercept=fit)
    regression.fit(x, y - y_intercept)

    r_sq = regression.score(x, y - y_intercept)
    m = regression.coef_[0]
    b = regression.intercept_ + y_intercept

    print(f"Fit intercept: {regression.fit_intercept}")
    print(f"r_sq: {r_sq:0.4f}\nm: {m:0.4f}\nb: {b:0.4f}")

    ax.plot(x, y, "bo")
    ax.plot(
        x,
        regression.predict(x) + y_intercept,
        "r" + "--" * fit,
        label=f"Fit Intercept: {regression.fit_intercept}",
    )

ax.set_title("A")
ax.set_ylabel("X")
ax.set_xlabel("Y")

ax.legend(loc="best")

plt.show()

这将打印:

Fit intercept: True
r_sq: 0.9473
m: 0.0017
b: -0.0192
Fit intercept: False
r_sq: 0.9112
m: 0.0014
b: 0.0000

结果与我从Excel得到的不匹配。我得到的是: r_sq:-3.1784 m:0.0014 b:0.0 - Qwynes
然而,从Excel中得出的结果是r-squared=0.9473,斜率为0.0014(与之匹配),y截距为0.115。我改成了“r_sq=round(regression.score(x,y-y_intercept),4)”,但r-squared仍然不匹配。我得到的是0.9112而不是0.9473。我需要改变其他参数吗? - Qwynes
我已经更新了我的回答,请看一下。当你拟合截距时,你会得到与Excel相同的R^2值。我不知道Excel在幕后做了什么,但我试着玩了一下:你可以将截距设置为任何非零值,它都会返回相同的 R^2值。在我看来,这似乎是Excel中的一个错误。 - David Hoffman
它可以工作,而且似乎Excel为两者都提供了相同的R^2值,所以可能是一个错误。我得到的数据有点不同,但它来自于你代码的复制和粘贴,并且除了“拟合截距:False”情况下的R^2值之外,它与Excel的结果匹配。 拟合截距:True r_sq:0.9473 m:0.0017 b:0.0958 拟合截距:False r_sq:0.9112 m:0.0014 b:0.1150 - Qwynes

1
我找到了一个通用解决方案,它给了我相同的答案,同时也允许我通过修改函数来拟合非线性方程。
import matplotlib.pyplot as plt
from scipy.optimize import curve_fit
import numpy as np

#set y-intercept
b=0.115

#Fitting function
def func(x, m):
    return (x*m)+b

#Experimental x and y data points    
x_A1 = np.array([0, 10, 20, 30, 40, 50, 60, 70, 80, 90, 100])
y_A1 = np.array([0.113, 0.116, 0.130, 0.150, 0.150, 0.160, 0.180, 0.210, 0.220, 0.260, 0.280])

#Plot experimental data points
plt.plot(x_A1, y_A1, 'bo', label='experimental')

#Perform the curve-fit
popt, pcov = curve_fit(func, x_A1, y_A1) #, initialGuess)
#print(popt)

#x values for the fitted function
x_A1_Fit = np.arange(x_A1[0], x_A1[-1], 0.1)

residuals = y_A1- func(x_A1, *popt)
ss_res = np.sum(residuals**2)
ss_tot = np.sum((y_A1-np.mean(y_A1))**2)
r_sq = 1 - (ss_res / ss_tot)

#Plot the fitted function
plt.plot(x_A1_Fit, func(x_A1_Fit, *popt), 'r--', label='fitted: m=%5.4f' % tuple(popt))

plt.xlabel('x')
plt.ylabel('y')
plt.legend()
plt.show()
print ('r_sq=', "%.4f"%r_sq, 'm=', "%.4f"%popt, "b=", "%.4f"%b)

0
我建议使用NumPy的线性代数库,特别是伪逆函数np.linalg.pinv。这种方法只需要使用NumPy包,如下所示。
import numpy as np
import matplotlib.pyplot as plt

x = np.array([0, 10, 20, 30, 40, 50, 60, 70, 80, 90, 100]).reshape(-1,1)
y = np.array([0.113, 0.116, 0.130, 0.150, 0.150, 0.160, 0.180, 0.210, 0.220, 0.260, 0.280])

b    =  0.115        # fixed intercept
a    =  np.linalg.pinv( x ) @ (y - b)  # estimated slope
yfit = (a * x) + b   # fitted y values


plt.figure()
plt.scatter(x, y, label='data')
plt.plot(x, yfit, label='fit')
plt.legend(loc='best')
plt.show()

regression with forced intercept


0


import numpy as np
import matplotlib.pyplot as plt
from scipy.optimize import curve_fit
from sklearn.metrics import r2_score
from sklearn.linear_model import LinearRegression

x=np.array([0, 10, 20, 30, 40, 50, 60, 70, 80, 90, 100]).reshape(-1,1)
y=np.array([0.113, 0.116, 0.130, 0.150, 0.150, 0.160, 0.180, 0.210, 0.220, 0.260, 0.280])

lr_fi_true = LinearRegression(fit_intercept=True)
lr_fi_false = LinearRegression(fit_intercept=False)

lr_fi_true.fit(x, y)
lr_fi_false.fit(x, y)

print('Intercept when fit_intercept=True : {:.5f}'.format(lr_fi_true.intercept_))
print('Intercept when fit_intercept=False : {:.5f}'.format(lr_fi_false.intercept_))

lr_fi_true_yhat = np.dot(x, lr_fi_true.coef_) + lr_fi_true.intercept_
lr_fi_false_yhat = np.dot(x, lr_fi_false.coef_) + lr_fi_false.intercept_

plt.scatter(x, y, label='Actual points')
plt.plot(x, lr_fi_true_yhat, 'r--', label='fit_intercept=True')
plt.plot(x, lr_fi_false_yhat, 'r-', label='fit_intercept=False')
plt.legend()

plt.vlines(0, 0, y.max())
plt.hlines(0, x.min(), x.max())

plt.show()

Intercept when fit_intercept=True : 0.09577
Intercept when fit_intercept=False : 0.00000

enter image description here


这个答案修复了图形,上面的答案提供了如何强制非零y截距的方法。 - Qwynes

网页内容由stack overflow 提供, 点击上面的
可以查看英文原文,
原文链接