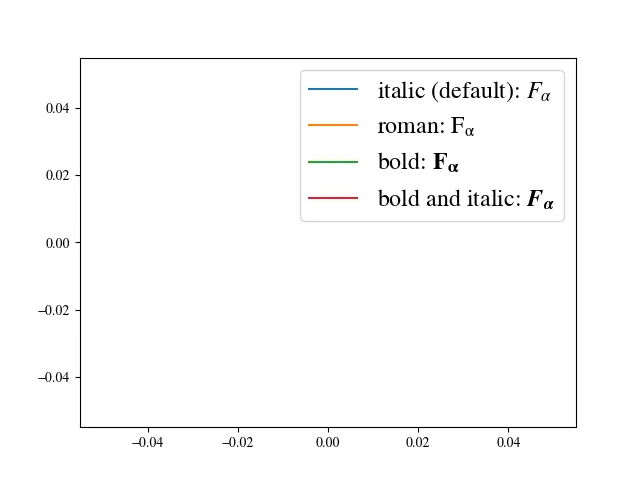
我正在尝试使用matplotlib生成图形,并使用“stix”字体(rcParams['mathtext.fontset'] ='stix')以便在文本和数学文本之间具有平滑的字体大小过渡。然而,我希望我的某些数学符号是斜体(标量值),而有些则是斜体且粗体(张量)。我不想使用Latex渲染的解决方案,因为那样会弄乱其他事情。
我将给您一个小例子来说明这个问题:
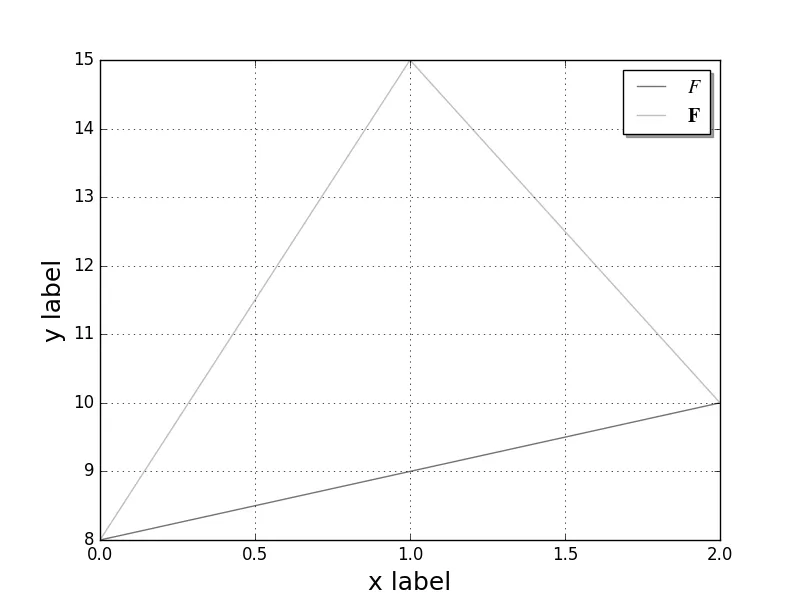
如果您运行代码,第一个标签是斜体,第二个标签是粗体。我该如何实现第二个标签既是粗体又是斜体?
我将给您一个小例子来说明这个问题:
from numpy import *
from matplotlib.pyplot import *
# Chaning font to stix
rcParams['mathtext.fontset'] = 'stix'
# Some data to constract this plotting example
datax=[0,1,2]
datay=[8,9,10]
datay2=[8,15,10]
fig, ay = subplots()
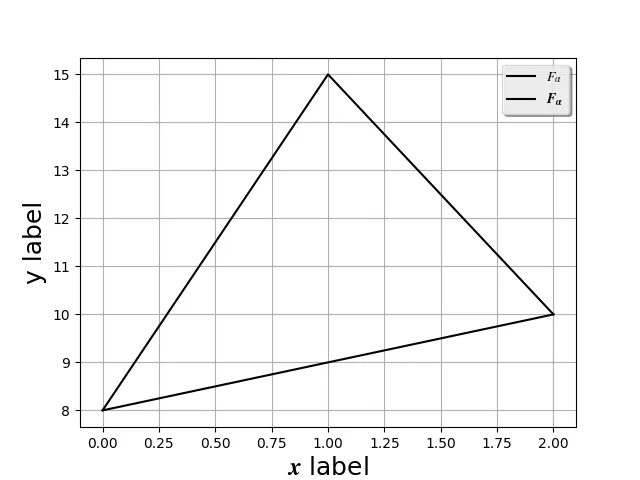
ay.plot(datax, datay, color="0.", ls='-', label= r"$F_{\alpha}$")
ay.plot(datax, datay2, color="0.", ls='-', label=r"$\mathbf{F_{\alpha}}$")
# Now add the legend with some customizations.
legend = ay.legend(loc='left', shadow=True)
#frame = legend.get_frame()
#frame.set_facecolor('0.90')
xlabel(r"x label",fontsize=18)
ylabel(r'y label', fontsize=18)
grid()
show()
如果您运行代码,第一个标签是斜体,第二个标签是粗体。我该如何实现第二个标签既是粗体又是斜体?