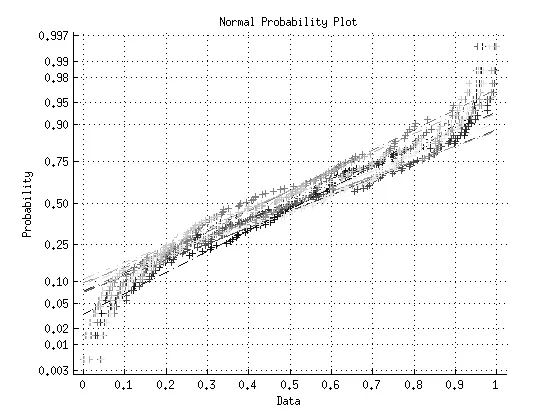
我有一组向量,形状为n乘m的矩阵,我想要计算m个正态概率图并叠加。这很简单:
c=rand(100,10);
figure
normplot(c)
normplot会自动为每列数据上色,但我需要控制它们的颜色。具体来说,我需要将它们变成灰度色。第一组数据(第一列)应该是白色(或接近白色),而最后一组数据应该是黑色。
我有一组向量,形状为n乘m的矩阵,我想要计算m个正态概率图并叠加。这很简单:
c=rand(100,10);
figure
normplot(c)
normplot会自动为每列数据上色,但我需要控制它们的颜色。具体来说,我需要将它们变成灰度色。第一组数据(第一列)应该是白色(或接近白色),而最后一组数据应该是黑色。
close all;
n = 100;
m = 10;
doc=rand(n,m);
figure;

% obtain the handle h to the dotted lines
h = normplot(doc);

% define colormap
g = colormap('gray');

for i = 1:m
    %set(h([1 11 21]),'color','r') % to set color to red
    %set(h([1 11 21]),'marker','o') % to change marker

    % mapping into greyscale color map (g has size 64x3)
    set(h([i i+m i+2*m]),'color',g(round(i * size(g,1)/m),:));
end