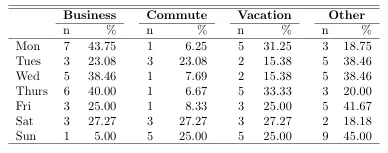
编辑:在以下aL3xa的回答基础上,我修改了他的语法。并不完美,但越来越接近了。我仍然没有找到让xtable接受列或行的\multicolumn {}参数的方法。似乎Hmisc处理了其中一些任务,但要理解发生了什么似乎需要花费一些时间。有没有人熟悉Hmisc中latex函数的使用?
ctab <- function(tab, dec = 2, margin = NULL) {
    tab <- as.table(tab)
    ptab <- paste(round(prop.table(tab, margin = margin) * 100, dec), "%", sep = "")
    res <- matrix(NA, nrow = nrow(tab) , ncol = ncol(tab) * 2, byrow = TRUE)
    oddc <- 1:ncol(tab) %% 2 == 1
    evenc <- 1:ncol(tab) %% 2 == 0
    res[,oddc ] <- tab
    res[,evenc ] <- ptab
    res <- as.table(res)
    colnames(res) <- rep(colnames(tab), each = 2)
    rownames(res) <- rownames(tab)
    return(res)
}
我希望创建一个表格,可用于LaTeX输出,其中包含每列或变量的计数和百分比。 我没有找到现成的解决方案,但感觉在某种程度上必须重新创造轮子。
我已经为直接制表开发了一个解决方案,但在采用交叉制表时遇到了困难。
首先是一些样本数据:
#Generate sample data
dow <- sample(1:7, 100, replace=TRUE)
purp <- sample(1:4, 100, replace=TRUE)
dow <- factor(dow, 1:7, c("Mon", "Tues", "Wed", "Thurs", "Fri", "Sat", "Sun"))
purp <- factor(purp, 1:4, c("Business", "Commute", "Vacation", "Other"))
下面是可用的制表符函数:
customTable <- function(var, capt = NULL){
    counts <- table(var)
    percs <- 100 * prop.table(counts)

    print(
        xtable(
            cbind(
                Count = counts
                , Percent = percs
            )
        , caption = capt
        , digits = c(0,0,2)
        )
    , caption.placement="top"
    )
}

#Usage
customTable(dow, capt="Day of Week")
customTable(purp, capt="Trip Pupose")
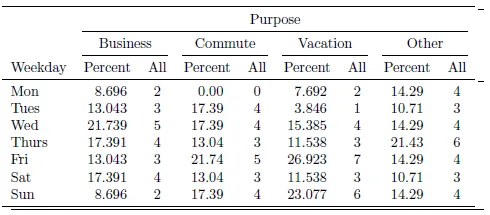
有没有人对将这个方法用于交叉表(例如按周几分组,再按出行目的分组)有什么建议?这是我当前编写的代码,它不使用xtable库,几乎能够完美运行,但不够灵活且难以处理:
#Create table and percentages
a <- table(dow, purp)
b <- round(prop.table(a, 1),2)

#Column bind all of the counts & percentages together, this SHOULD become dynamic in future
d <- cbind( cbind(Count = a[,1],Percent =  b[,1])
        , cbind(Count = a[,2], Percent = b[,2])
        , cbind(Count = a[,3], Percent = b[,3])
        , cbind(Count = a[,4], Percent = b[,4])
)

#Ugly function that needs help, or scrapped for something else
crossTab <- function(title){
    cat("\\begin{table}[ht]\n")
    cat("\\begin{center}\n")
    cat("\\caption{", title, "}\n", sep="")

    cat("\\begin{tabular}{rllllllll}\n")
    cat("\\hline\n")

    cat("", cat("", paste("&\\multicolumn{2}{c}{",colnames(a), "}"), sep = ""), "\\\\\n", sep="")
    c("&", cat("", colnames(d), "\\\\\n", sep=" & "))
    cat("\\hline\n")
    c("&", write.table(d, sep = " & ", eol="\\\\\n", quote=FALSE, col.names=FALSE))

    cat("\\hline\n")
    cat("\\end{tabular}\n")
    cat("\\end{center}\n")
    cat("\\end{table}\n")
}

crossTab(title = "Day of week BY Trip Purpose")
xtable文档,并瞥一眼我的答案(注意这位自大之人的话)。 - aL3xa