基本的 WPF LiveCharts DateTime 示例无法工作

5

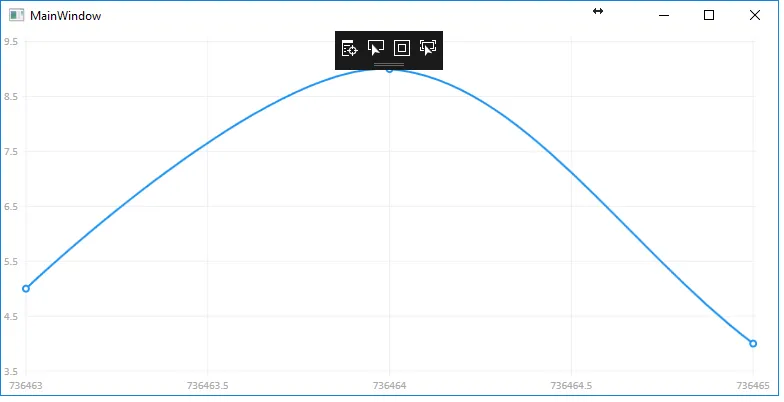
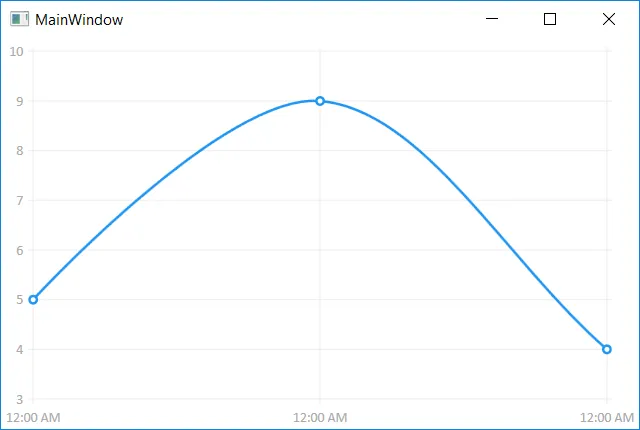
我尽可能地按照Live Charts TimeDate基本示例进行了跟踪,但似乎无法正确显示X轴。

https://lvcharts.net/App/examples/v1/wpf/Date%20Time

我的MainWindow代码:

public partial class MainWindow : Window
{
    public Func<double, string> Formatter { get; set; }

    public MainWindow()
    {
        InitializeComponent();

        var dayConfig = Mappers.Xy<DateModel>()
          .X(dateModel => dateModel.DateTime.Ticks / TimeSpan.FromDays(1).Ticks)
          .Y(dateModel => dateModel.Value);

        SeriesCollection Series = new SeriesCollection(dayConfig)
        {
            new LineSeries
            {
                Title = "Google Rank",

                Values = new ChartValues<DateModel>
                {
                    new Wpf.CartesianChart.Using_DateTime.DateModel
                    {
                        DateTime    = System.DateTime.UtcNow,
                        Value       = 5
                    },
                    new Wpf.CartesianChart.Using_DateTime.DateModel
                    {
                        DateTime    = System.DateTime.UtcNow.AddDays(1),
                        Value       = 9
                    },
                    new Wpf.CartesianChart.Using_DateTime.DateModel
                    {
                        DateTime    = System.DateTime.UtcNow.AddDays(2),
                        Value       = 4
                    }
                },

                Fill = Brushes.Transparent,

            },
        };

        Formatter = value => new System.DateTime((long)(value * TimeSpan.FromDays(1).Ticks)).ToString("t");

        RankGraph.Series = Series;
    }
}

我的MainWindow上的XAML

<Grid>
    <lvc:CartesianChart x:Name="RankGraph" Series="{Binding Series}">
        <lvc:CartesianChart.AxisX>
            <lvc:Axis LabelFormatter="{Binding Formatter}"></lvc:Axis>
        </lvc:CartesianChart.AxisX>
    </lvc:CartesianChart>
</Grid>

日期模型对象

namespace Wpf.CartesianChart.Using_DateTime
{
    public class DateModel
    {
        public DateTime DateTime { get; set; }
        public double Value { get; set; }
    }
}

这将会产生以下结果,但日期会混乱...

在此输入图片描述

3个回答

8

你忘记设置数据上下文:

DataContext = this;

enter image description here


3

由于某些原因,XAML中的LiveCharts绑定有时无法正常工作。 您需要在XAML中为LiveCharts控件命名(任何名称都可以):

<lvc:CartesianChart x:Name="RankGraph" Series="{Binding Series}">
<lvc:Axis x:Name="RankGraphAxisX" LabelFormatter="{Binding Formatter}"></lvc:Axis>

然后在代码后端绑定Series和LabelFormatter:
RankGraph.Series = Series;
RankGraphAxisX.LabelFormatter = Formatter;

0

不知道这对任何人是否有用,但我也阅读了他们网站上发布的示例代码。我继续阅读有关LiveCharts的更多信息,并遇到了他们的DateTimePoint类(LiveCharts.Defaults.DateTimePoint)。我刚开始使用这些控件,但乍一看,它正在绘制我期望看到的内容。

我的问题是,我有一堆笛卡尔点,类型为<DateTime,double>,但DateTime并不是定期分布的 - 因此我有数据点,例如("2015年1月1日00:00",9.5)、("2015年1月20日04:00",10)、("2016年1月4日06:46",5.2)等。我想到不规则时间间隔最好由它们的散点图覆盖,而我正在使用WPF开发我的应用程序,因此我最终使用了XAML。

    ....
    xmlns:x="http://schemas.microsoft.com/winfx/2006/xaml"        
    xmlns:lvc="clr-namespace:LiveCharts.Wpf;assembly=LiveCharts.Wpf"
    ...    
    <lvc:CartesianChart DataTooltip="{x:Null}">
        <lvc:CartesianChart.Series>
            <lvc:ScatterSeries Title="Raw Data" Values="{Binding RawDataSeries}" />
        </lvc:CartesianChart.Series>
        ....

现在,我恰好采用了MVVM方法(请注意我的绑定),因此在相应的ViewModel中,我编写了该方法

public ChartValues<DateTimePoint> RawDataSeries
{
    get
    {
        ChartValues<DateTimePoint> Values = new ChartValues<DateTimePoint>();
        foreach (DatabaseEntry dbe in _Readings)
        {
            Values.Add(new DateTimePoint(dbe.Timestamp, dbe.Value));
        }
        return Values;
    }
}

显然,这比他们网页上的代码少得多。DatabaseEntry是我的其中之一 - 它只是一个容器,包含7或8个属性,包括时间戳(DateTime)和值(double)。

我仍在编写此代码,因此我肯定还有更多工作要做,但就开始而言,到目前为止我看到的基本上是我所期望看到的。


进一步研究后发现,他们只是使用DateTime.Ticks并将其转换为double,以包含在ObservablePoint中。我目前看到的标签是如6E17等,而不是日期时间,因此需要想办法正确格式化它们。但是希望这仍然会减少代码量。 - PeteH

网页内容由stack overflow 提供, 点击上面的
可以查看英文原文,
原文链接