我的服务器运行在CentOS 6.7上,使用1.8.0_92版本的Java,并设置GC参数为'-Xms16g -Xmx16g -XX:+UseG1GC'。所以默认的InitiatingHeapOccupancyPercent是45,G1HeapWastePercent是5,G1MixedGCLiveThresholdPercent是85。我的服务器的mixed GC从7.2GB开始,但清理的越来越少,最终老年代保持大于7.2GB,因此它总是尝试进行并发标记。最终所有堆都报错了,发生了full GC。full GC后,老年代使用量低于500MB。
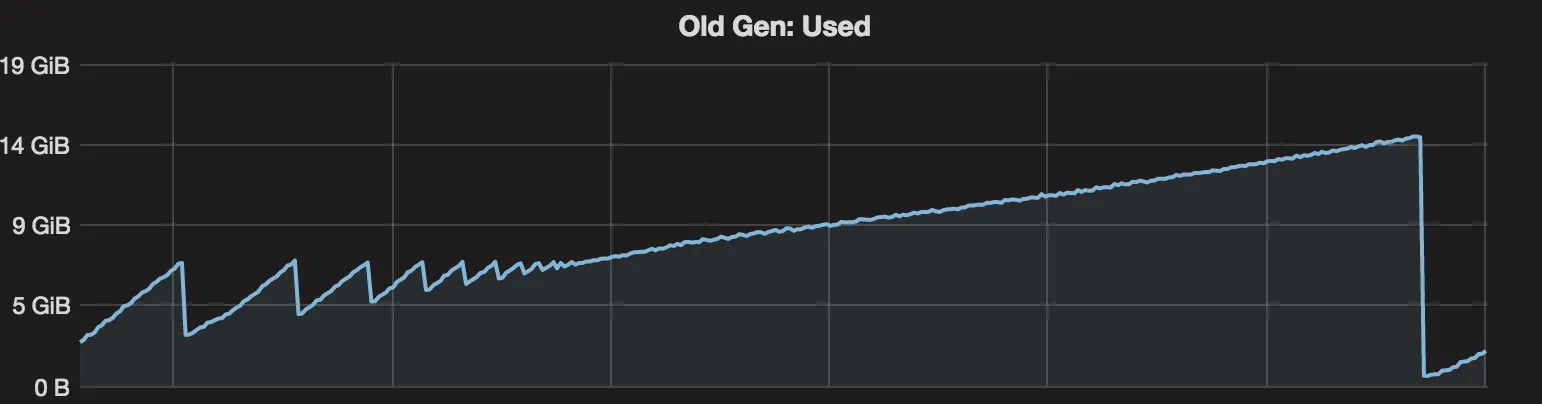
我很好奇为什么我的mixed GC无法收集更多数据,似乎存活数据并不是很多...
我尝试打印相关的g1信息,并发现许多像下面的消息,看起来我的老年代包含了很多存活数据,但为什么full GC可以收集这么多...
G1Ergonomics (Mixed GCs) do not continue mixed GCs, reason: reclaimable percentage not over threshold, candidate old regions: 190 regions, reclaimable: 856223240 bytes (4.98 %), threshold: 5.00 %
以下日志是将 InitiatingHeapOccupancyPercent 修改为 15(在2.4GB处开始并发标记)以加速的结果。
### PHASE Post-Marking
......
### SUMMARY  capacity: 16384.00 MB  used: 2918.42 MB / 17.81 %  prev-live: 2407.92 MB / 14.70 %  next-live: 2395.00 MB / 14.62 %  remset: 56.66 MB  code-roots: 0.91 MB
### PHASE Post-Sorting
....
### SUMMARY  capacity: 1624.00 MB  used: 1624.00 MB / 100.00 %  prev-live: 1123.70 MB / 69.19 %  next-live: 0.00 MB / 0.00 %  remset: 35.90 MB  code-roots: 0.89 MB
编辑:
我尝试在混合GC后触发完整GC,仍然可以将内存减少到4xx MB,因此看起来我的老年代有更多的数据可以被收集。
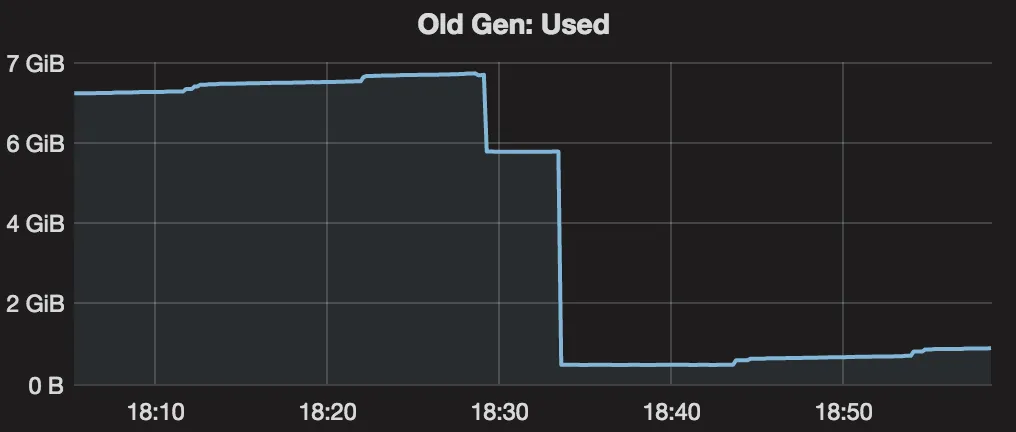
在进行完整GC之前,混合GC日志为:
 32654.979: [G1Ergonomics (Mixed GCs) start mixed GCs, reason: candidate old regions available, candidate old regions: 457 regions, reclaimable: 2956666176 bytes (17.21 %), threshold: 5.00 %], 0.1106810 secs]
 ....
 [Eden: 6680.0M(6680.0M)->0.0B(536.0M) Survivors: 344.0M->280.0M Heap: 14.0G(16.0G)->7606.6M(16.0G)]
 [Times: user=2.31 sys=0.01, real=0.11 secs]
 ...
 [GC pause (G1 Evacuation Pause) (mixed)
 ...
 32656.876: [G1Ergonomics (CSet Construction) finish adding old regions to CSet, reason: old CSet region num reached max, old: 205 regions, max: 205 regions]
 32656.876: [G1Ergonomics (CSet Construction) finish choosing CSet, eden: 67 regions, survivors: 35 regions, old: 205 regions, predicted pause time: 173.84 ms, target pause time: 200.00 ms]
 32656.992: [G1Ergonomics (Mixed GCs) continue mixed GCs, reason: candidate old regions available, candidate old regions: 252 regions, reclaimable: 1321193600 bytes (7.69 %), threshold: 5.00 %]
 [Eden: 536.0M(536.0M)->0.0B(720.0M) Survivors: 280.0M->96.0M Heap: 8142.6M(16.0G)->6029.9M(16.0G)]
 [Times: user=2.49 sys=0.01, real=0.12 secs]
 ...
 [GC pause (G1 Evacuation Pause) (mixed)
 ...
 32659.727: [G1Ergonomics (CSet Construction) finish adding old regions to CSet, reason: reclaimable percentage not over threshold, old: 66 regions, max: 205 regions, reclaimable: 857822432 bytes (4.99 %), threshold: 5.00 %]
 32659.727: [G1Ergonomics (CSet Construction) finish choosing CSet, eden: 90 regions, survivors: 12 regions, old: 66 regions, predicted pause time: 120.51 ms, target pause time: 200.00 ms]
 32659.785: [G1Ergonomics (Mixed GCs) do not continue mixed GCs, reason: reclaimable percentage not over threshold, candidate old regions: 186 regions, reclaimable: 857822432 bytes (4.99 %), threshold: 5.00 %]
 [Eden: 720.0M(720.0M)->0.0B(9064.0M) Survivors: 96.0M->64.0M Heap: 6749.9M(16.0G)->5572.0M(16.0G)]
 [Times: user=1.20 sys=0.00, real=0.06 secs]
编辑:2016/12/11
我使用-Xmx4G从另一台机器中转储了堆。
我使用lettuce作为redis客户端,并使用LatencyUtils进行跟踪功能。每10分钟(默认情况下重置延迟发布后为true,https://github.com/mp911de/lettuce/wiki/Command-Latency-Metrics),它会使LatencyStats(其中包含约3000个元素的long[])实例弱引用。因此,长时间后会产生大量的LatencyStats的弱引用。
在Full GC之前。
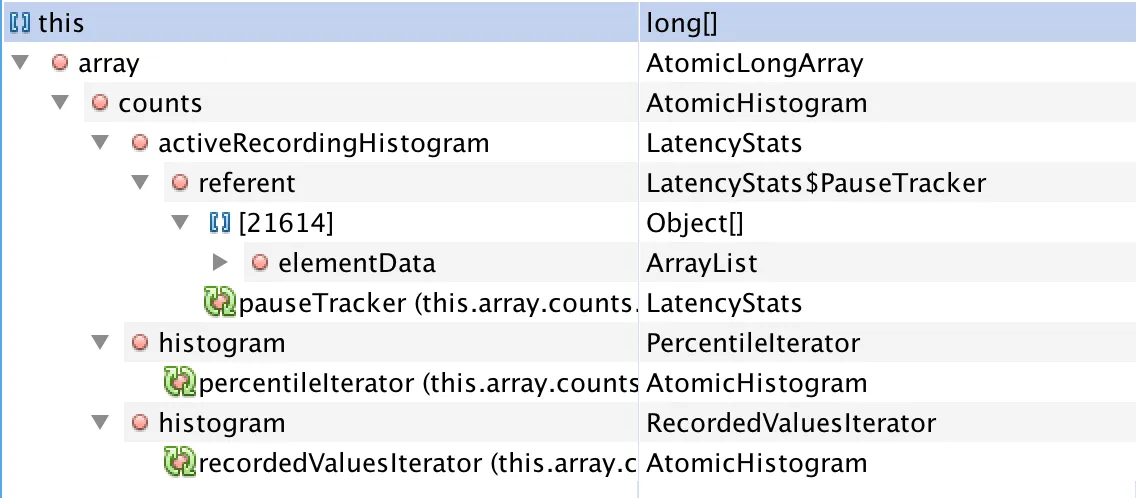


完全GC后。

目前我不需要lettuce的跟踪功能,所以只需将其禁用即可,这样它就不会再进行完全GC了。但是不确定为什么混合gc不能清除它们。
### PHASE Post-Marking是 G1PrintRegionLivenessInfo,看起来它仍然有超过1GB的活动数据。而且巨大对象并没有显示很多[Humongous Total: 1] [Humongous Candidate: 1]。我会检查如何知道它是否来自软引用..(有关此内容的任何文档吗?) - koji linSoftRefLRUPolicyMSPerMB。 - koji lin