我正在尝试使用pyplot制作2D图。我读入了一个包含多个列的文件,每个列都包含大约100个值,介于1和10之间。我正在将第5列绘制在第6列上,这很好。
我还想用来自第0列的整数值标记结果线条。因此,该线将具有11个点,位于列0为整数的位置(x,y)。我也希望这些点用该整数进行标记。
非常感谢您的帮助,这让我发疯了!
我还想用来自第0列的整数值标记结果线条。因此,该线将具有11个点,位于列0为整数的位置(x,y)。我也希望这些点用该整数进行标记。
非常感谢您的帮助,这让我发疯了!
numpy.loadtxt,如果您还没有使用过。在您的特定情况下,您可以执行以下操作:z, x, y = np.loadtxt('data.txt', usecols=[0, 5, 6]).T
import numpy as np
import matplotlib.pyplot as plt
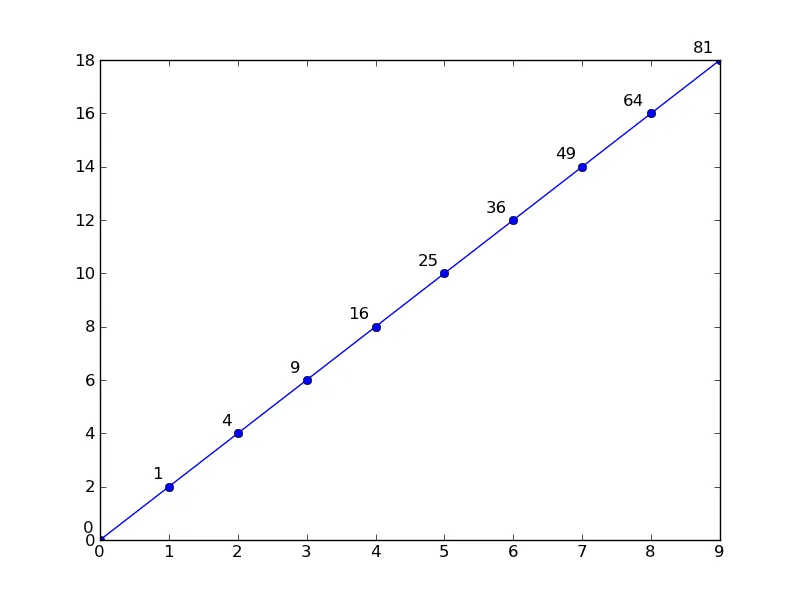
x = np.arange(10)
y = 2 * x
z = x ** 2
fig, ax = plt.subplots()
ax.plot(x, y, 'bo-')
for X, Y, Z in zip(x, y, z):
# Annotate the points 5 _points_ above and to the left of the vertex
ax.annotate('{}'.format(Z), xy=(X,Y), xytext=(-5, 5), ha='right',
textcoords='offset points')
plt.show()
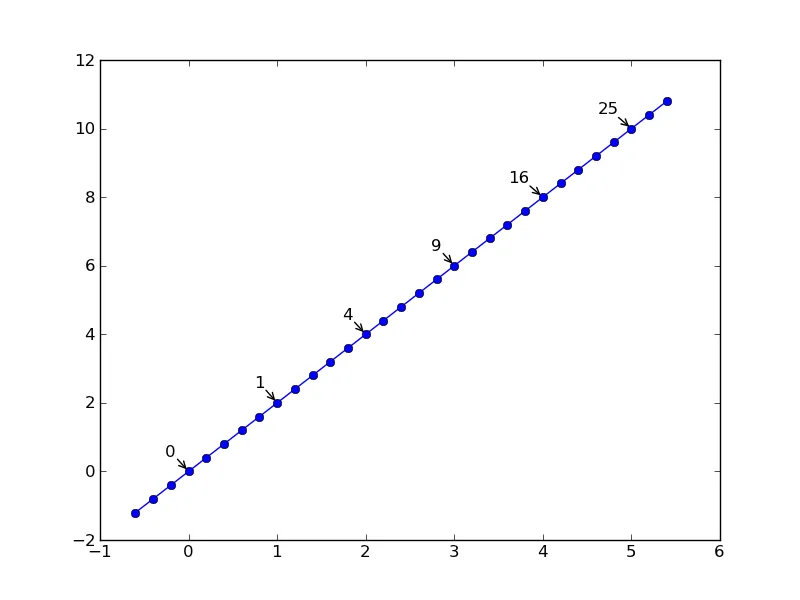
现在,对于第二个选项,我们可能会有类似于 @mathematical.coffee 建议的这样的东西:
import numpy as np
import matplotlib.pyplot as plt

x = np.arange(-0.6, 5.6, 0.2)
y = 2 * x
z = x**2

fig, ax = plt.subplots()
ax.plot(x, y, 'bo-')

# Note the threshold... I'm assuming you want 1.000001 to be considered an int.
# Otherwise, you'd use "z % 1 == 0", but beware exact float comparisons!!
integers = z % 1 < 1e-6
for (X, Y, Z) in zip(x[integers], y[integers], z[integers]):
    ax.annotate('{:.0f}'.format(Z), xy=(X,Y), xytext=(-10, 10), ha='right',
                textcoords='offset points',
                arrowprops=dict(arrowstyle='->', shrinkA=0))

plt.show()
TypeError: __init__() missing 1 required positional argument: 's',出现在这一行 arrowprops=dict(arrowstyle='->', shrinkA=0)。 - sunwarr10r
vals[vals % 1 == 0]可以找到整数,而你可以使用matplotlib.pyplot.text来绘制文本。对于所有的x,y对,使用plt.text(x,y,str(y))。 - mathematical.coffee