我正在运行R语言代码来创建地图:
library(tidyverse)
library(ggplot2)
library(eurostat)
library(janitor)
library(sf)

eugd <- eurostat_geodata_60_2016 %>% clean_names()
eugdtr <- eugd %>% st_transform(crs = 3035)
gd_de <- eugdtr %>% filter(cntr_code == "DE", levl_code == 2)

# download the dataset
# Economically active population (unit: 1000)
df_d <- get_eurostat("lfst_r_lfp2act")

df_de <- df_d %>%
  filter(
    geo %>% str_sub(1,2) == "DE", # only Italy
    geo %>% paste %>% nchar == 4, # only NUTS-2
    age %in% c("Y15-24")# my guess is that most of our problems were because of the Russian Doll (Matreshka) effect of the way spatial data is organized
  ) %>%
  transmute(
    id = geo %>% paste,
    year = time %>% lubridate::year(),
    eap = values,
    sex = sex
  ) %>%
  group_by(id,year) %>%
  summarise(eap= sum(eap)) %>% ungroup()

de <- left_join(gd_de, df_de, "id")

library(viridis)
library(cowplot)

# choose year=2000
de %>%
  filter(year %in% c(2000)) %>%
  ggplot()+
  geom_sf(aes(fill = eap), color = NA)+
  scale_fill_viridis_b()+
  coord_sf(datum = NA)+
  theme_map()+
  theme(legend.position="right",
        plot.title = element_text(hjust = 0.5,color = "Gray40", size = 16, face = "bold"),
        plot.subtitle = element_text(color = "blue"),
        plot.caption = element_text(color = "Gray60"))+
  guides(fill = guide_legend(title = "Unit: 1000", title.position = "bottom", title.theme =element_text(size = 10, face = "bold",colour = "gray70",angle = 0)))
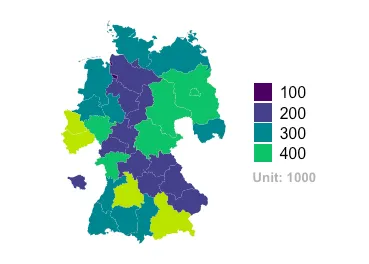
我获得了这样的一个图形:
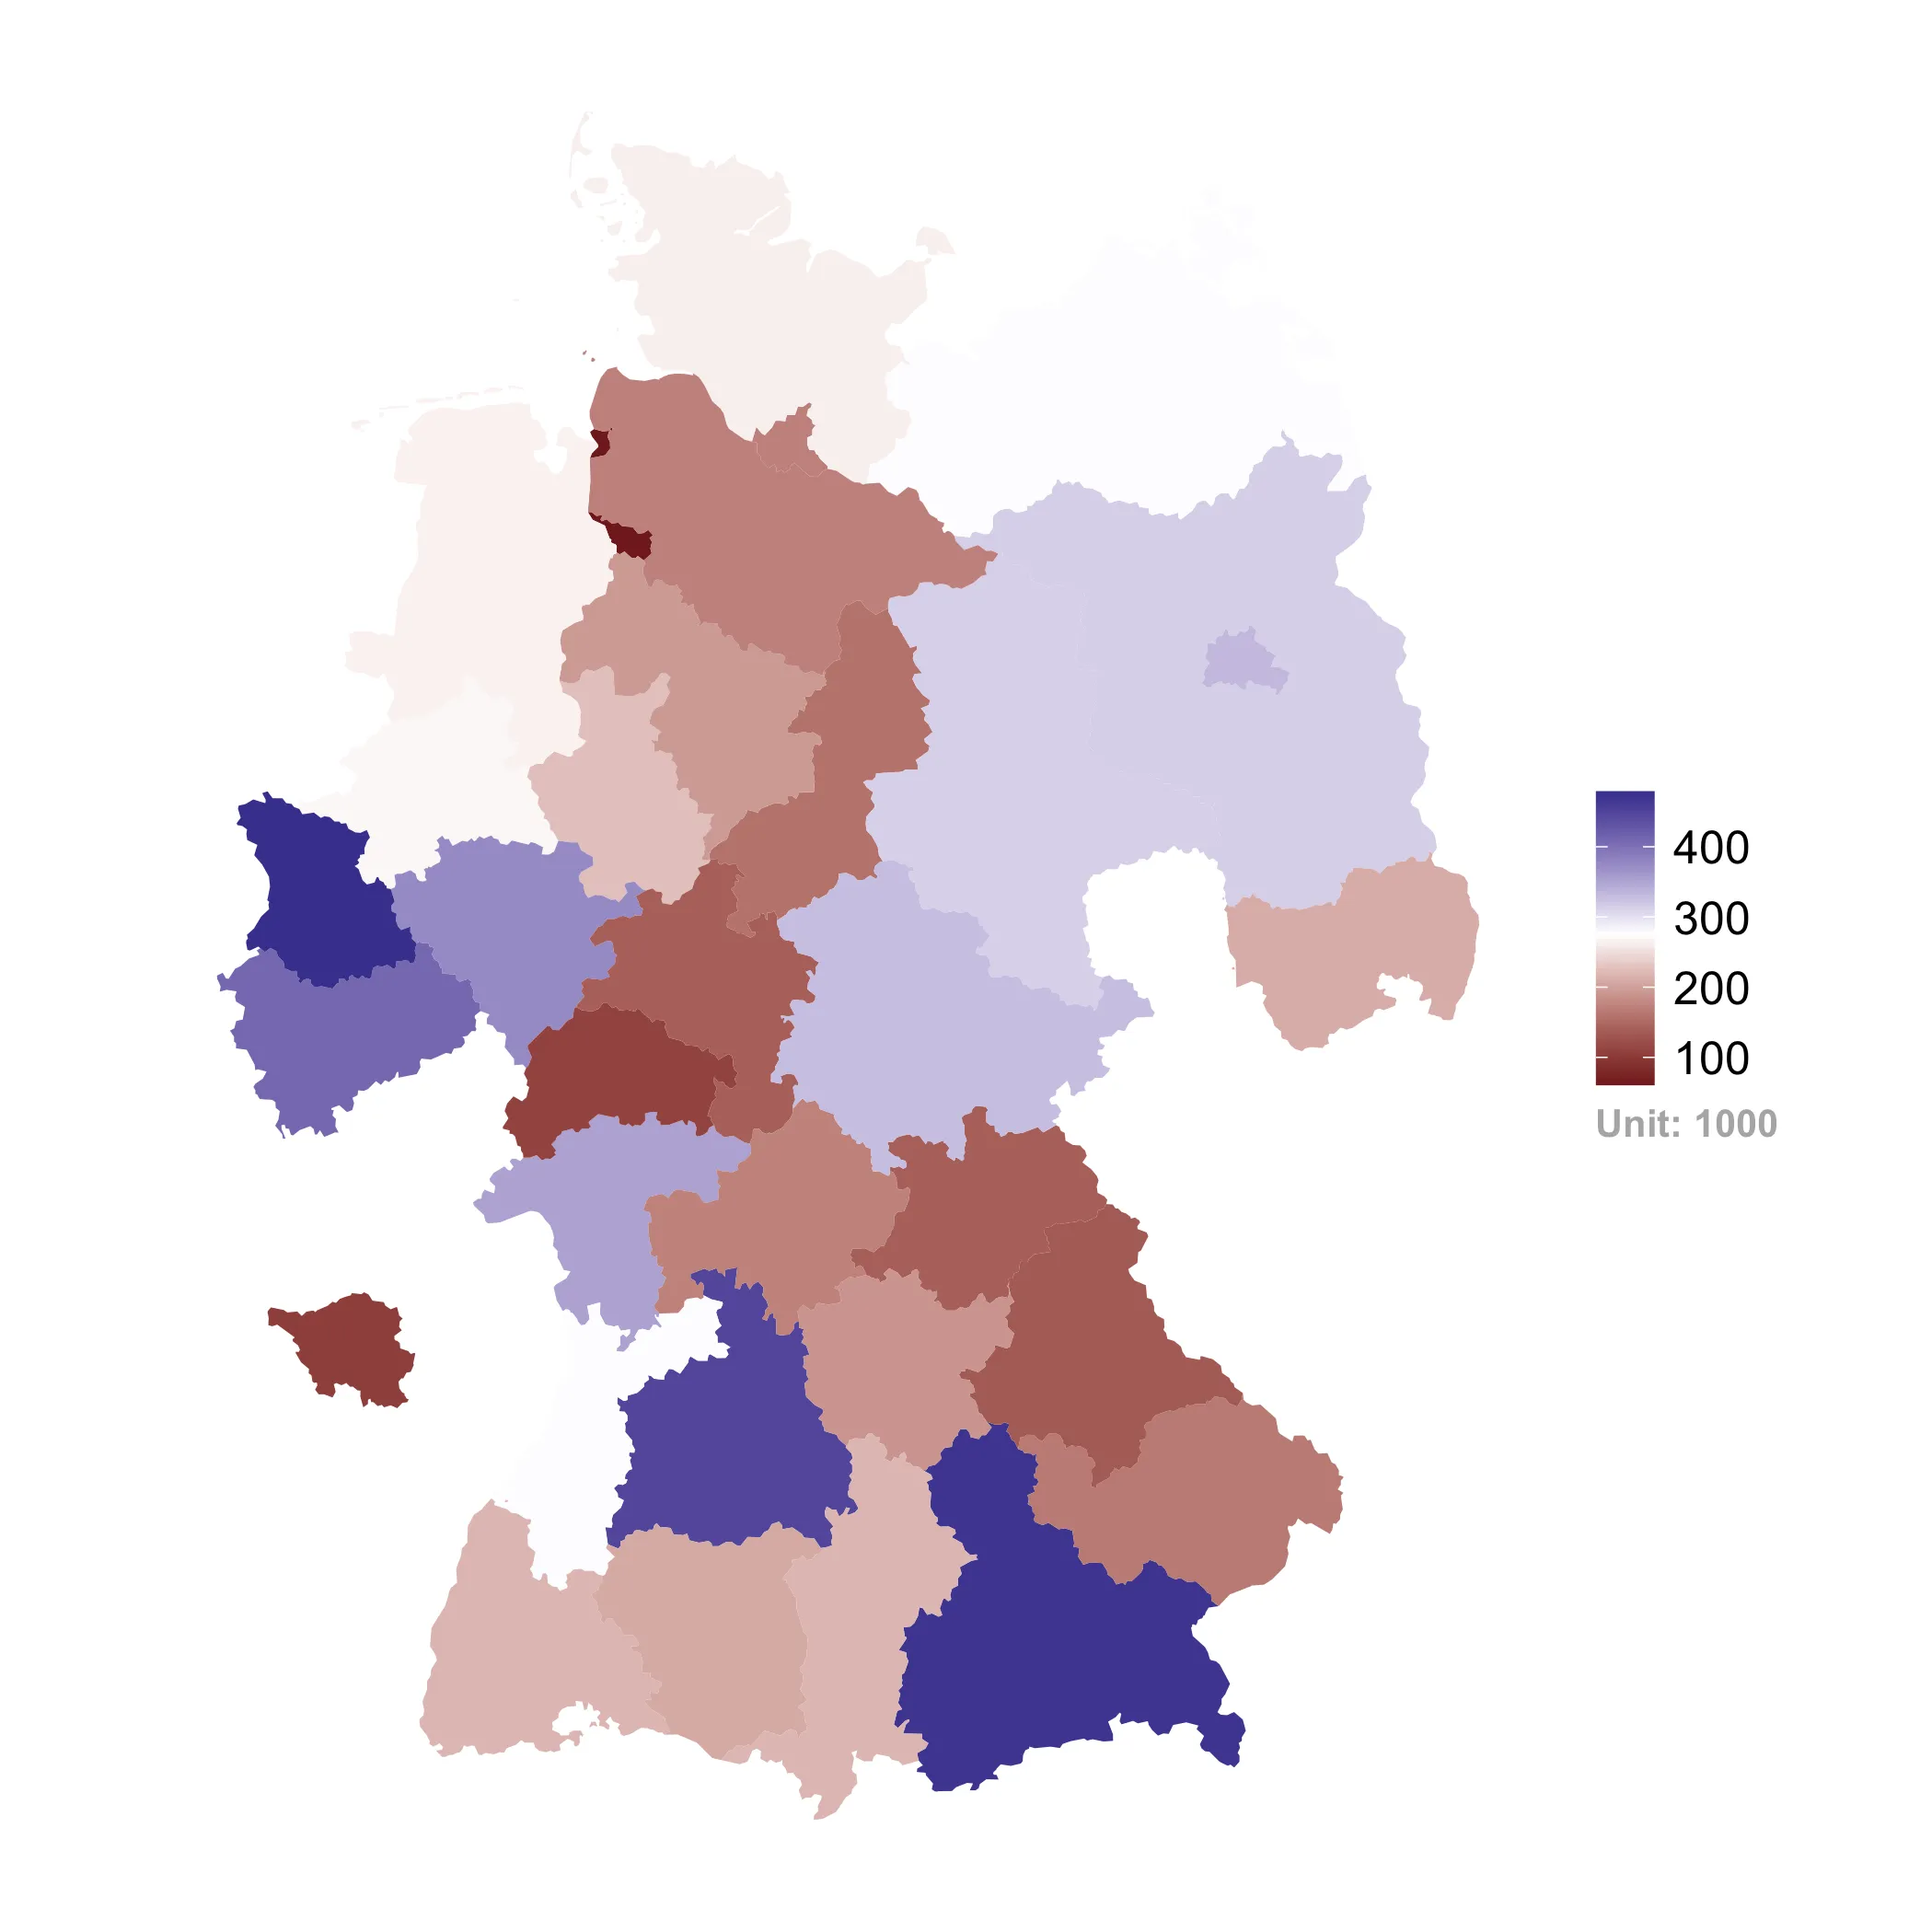
然而,我想要更改图例以及填充在地图上的颜色为连续的颜色(因为特征“eap”是一个连续变量),而不是像这样离散的变量。例如,像这样:
我已经尝试过
scale_fill_viridis_c()
并且
scale_colour_gradient2()
两者都不起作用。
如果有人能帮忙解决这个问题,将不胜感激。 非常感谢。