R markdown:简化创建图表和文本表格

3
对于 R markdown(Rmd)网页,我希望生成包含缩略图图片(链接到更大的图片或网站)的表格,并在第二列中添加描述性文本。一个例子如下图所示:

example image

我知道可以在原始HTML中手动创建此内容,但那很繁琐且耗时。一定有更简单的方法。
在另一页上,我尝试使用Markdown / Pandoc表格,但没有成功,最终还是回到了手动编写HTML的方式。
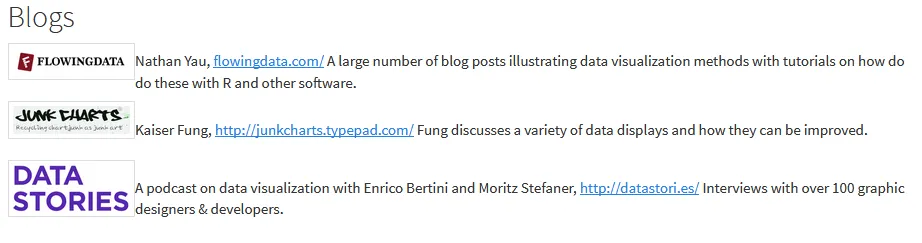
icon                                              | title
--------------------------------------------------+--------------------------
<img src="images/books/R-Graphics.jpg" height=50> |Paul Murrell, *R Graphics*, 2nd Ed.
<img src="images/books/R-graphics-cookbook.jpg" height=50> | Winston Chang, R Graphics Cookbook
<img src="images/books/lattice.png" height=50> | Deepayan Sarkar, *lattice*
<img src="images/books/ggplot2.jpg" height=50> | Hadley Wickham, *ggplot2*

也许在这里使用 htmltools 包会很有用,但我不太清楚如何在我的应用程序中使用它的 Rmd 文件。
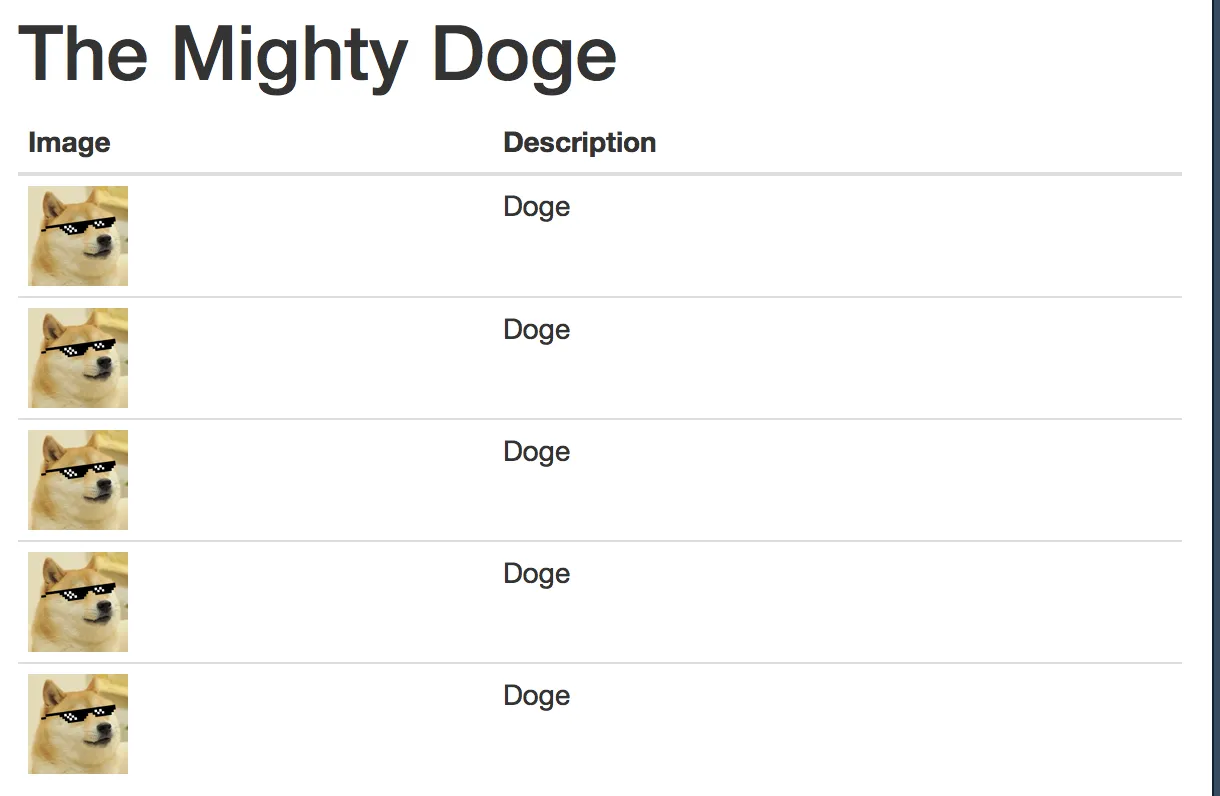
2个回答

3

可能忘记了转义引号?这对我来说很好用:

---
title: "The Mighty Doge"
output: html_document
---

```{r}
library(knitr)
create_thumbnail <- function(file) {
  paste0("<a href=\"", file, "\"><img src=\"", file, "\" style=\"width: 50px;\"/></a>")
}
df <- data.frame(Image       = rep("unnamed.png", 5), 
                 Description = rep("Doge", 5))

df$Image <- create_thumbnail(df$Image)
kable(df)
```

enter image description here


这很有帮助。我还没有尝试过使用data.framekable。当然,接下来的挑战就是将我的示例信息放入一个数据框中。 - user101089
我在将文本和图片制作成PDF时遇到了类似的困难(没有缩略图)。请参考我的相关帖子:https://dev59.com/e7bna4cB1Zd3GeqPe6xE 非常感谢您的帮助。 - mavericks

0
这里有一种方法,使用htmltools,看起来更加灵活,因为我可以更容易地控制细节。
我不熟悉bootstrap <div>结构,所以我使用了HTML表格结构。我必须定义tr()td()等函数。
```{r html-setup, echo=FALSE}
library(htmltools)
# table tags
tab <- function (...)
tags$table(...)

td <- function (...) 
    tags$td(...)
tr <- function (...) 
    tags$tr(...)

# an <a> tag with href as the text to be displayed
aself <- function (href, ...)
    a(href, href=href, ...)

```

然后编写函数以按照我想要的方式构造表格条目:
```{r table-functions, echo=FALSE}
# thumnail figure with href in a table column
tabfig <- function(name, img, href, width) {
        td(
      a(class = "thumbnail", title = name, href = href,
        img(src = img, width=width)
       )
    )
}
tabtxt <- function(text, ...) {
        td(text, ...)
}
```

最后,使用它们来输入条目:
## Blogs

```{r do-blogs, echo=FALSE}
width="160px"
tab(
  tr(
    tabfig("FlowingData", "images/blogs/flowingdata.png", "http://flowingdata.com/", width=width),
    tabtxt("Nathan Yau,", aself("flowingdata.com/"),
           "A large number of blog posts illustrating data visualization methods with tutorials on how do do these with R and other software.")
    ),

  tr(
    tabfig("Junk Charts", "images/blogs/junkcharts.png", "http://junkcharts.typepad.com/", width=width),
    tabtxt("Kaiser Fung,", aself("http://junkcharts.typepad.com/"),
           "Fung discusses a variety of data displays and how they can be improved.")
    ),

  tr(
    tabfig("Data Stories", "images/blogs/datastories.png", "http://datastori.es/", width=width),
    tabtxt("A podcast on data visualization with Enrico Bertini and Moritz Stefaner,",
           aself("http://datastori.es/"), 
           "Interviews with over 100 graphic designers & developers.")
    )
)
```

我仍然需要调整填充,但这基本上给了我我想要的东西:

enter image description here


网页内容由stack overflow 提供, 点击上面的
可以查看英文原文,
原文链接