这是我找到的最好的解决方案:
hist( x, nclass = 100, cex.lab=1.5, xlab = expression(hat(phi)~"*"),
      ylab="Frequency", main="", cex.axis=1.5 )
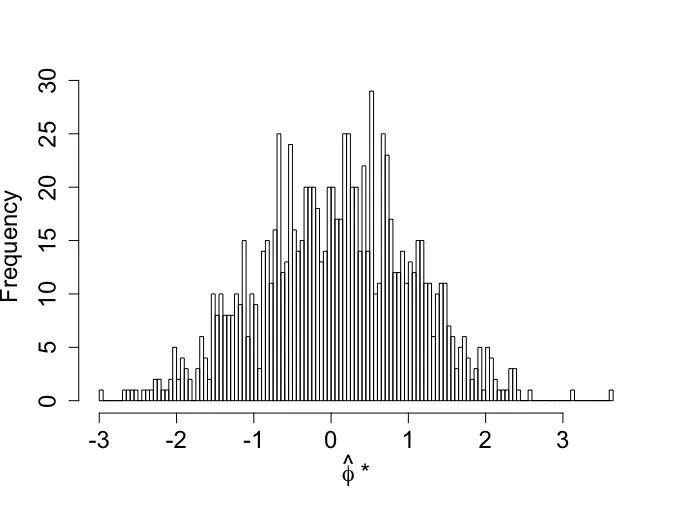
要获得帽子下面的星号,我不知道任何使用基本绘图函数的漂亮解决方案。我认为 @Maurits Evers 的方法是复杂性和结果美观之间的最佳折衷。
但是,这里有一种更“高级”(也许有点过头了,但好吧……)的解决方案。它基于这篇博客文章:http://iltabiai.github.io/tips/latex/2015/09/15/latex-tikzdevice-r.html
为使其正常工作,您需要安装 tikzDevice 包。
首先,加载包并创建数据集。
library(tikzDevice)
library(ggplot2)
dat <- data.frame(x = rnorm(1000))
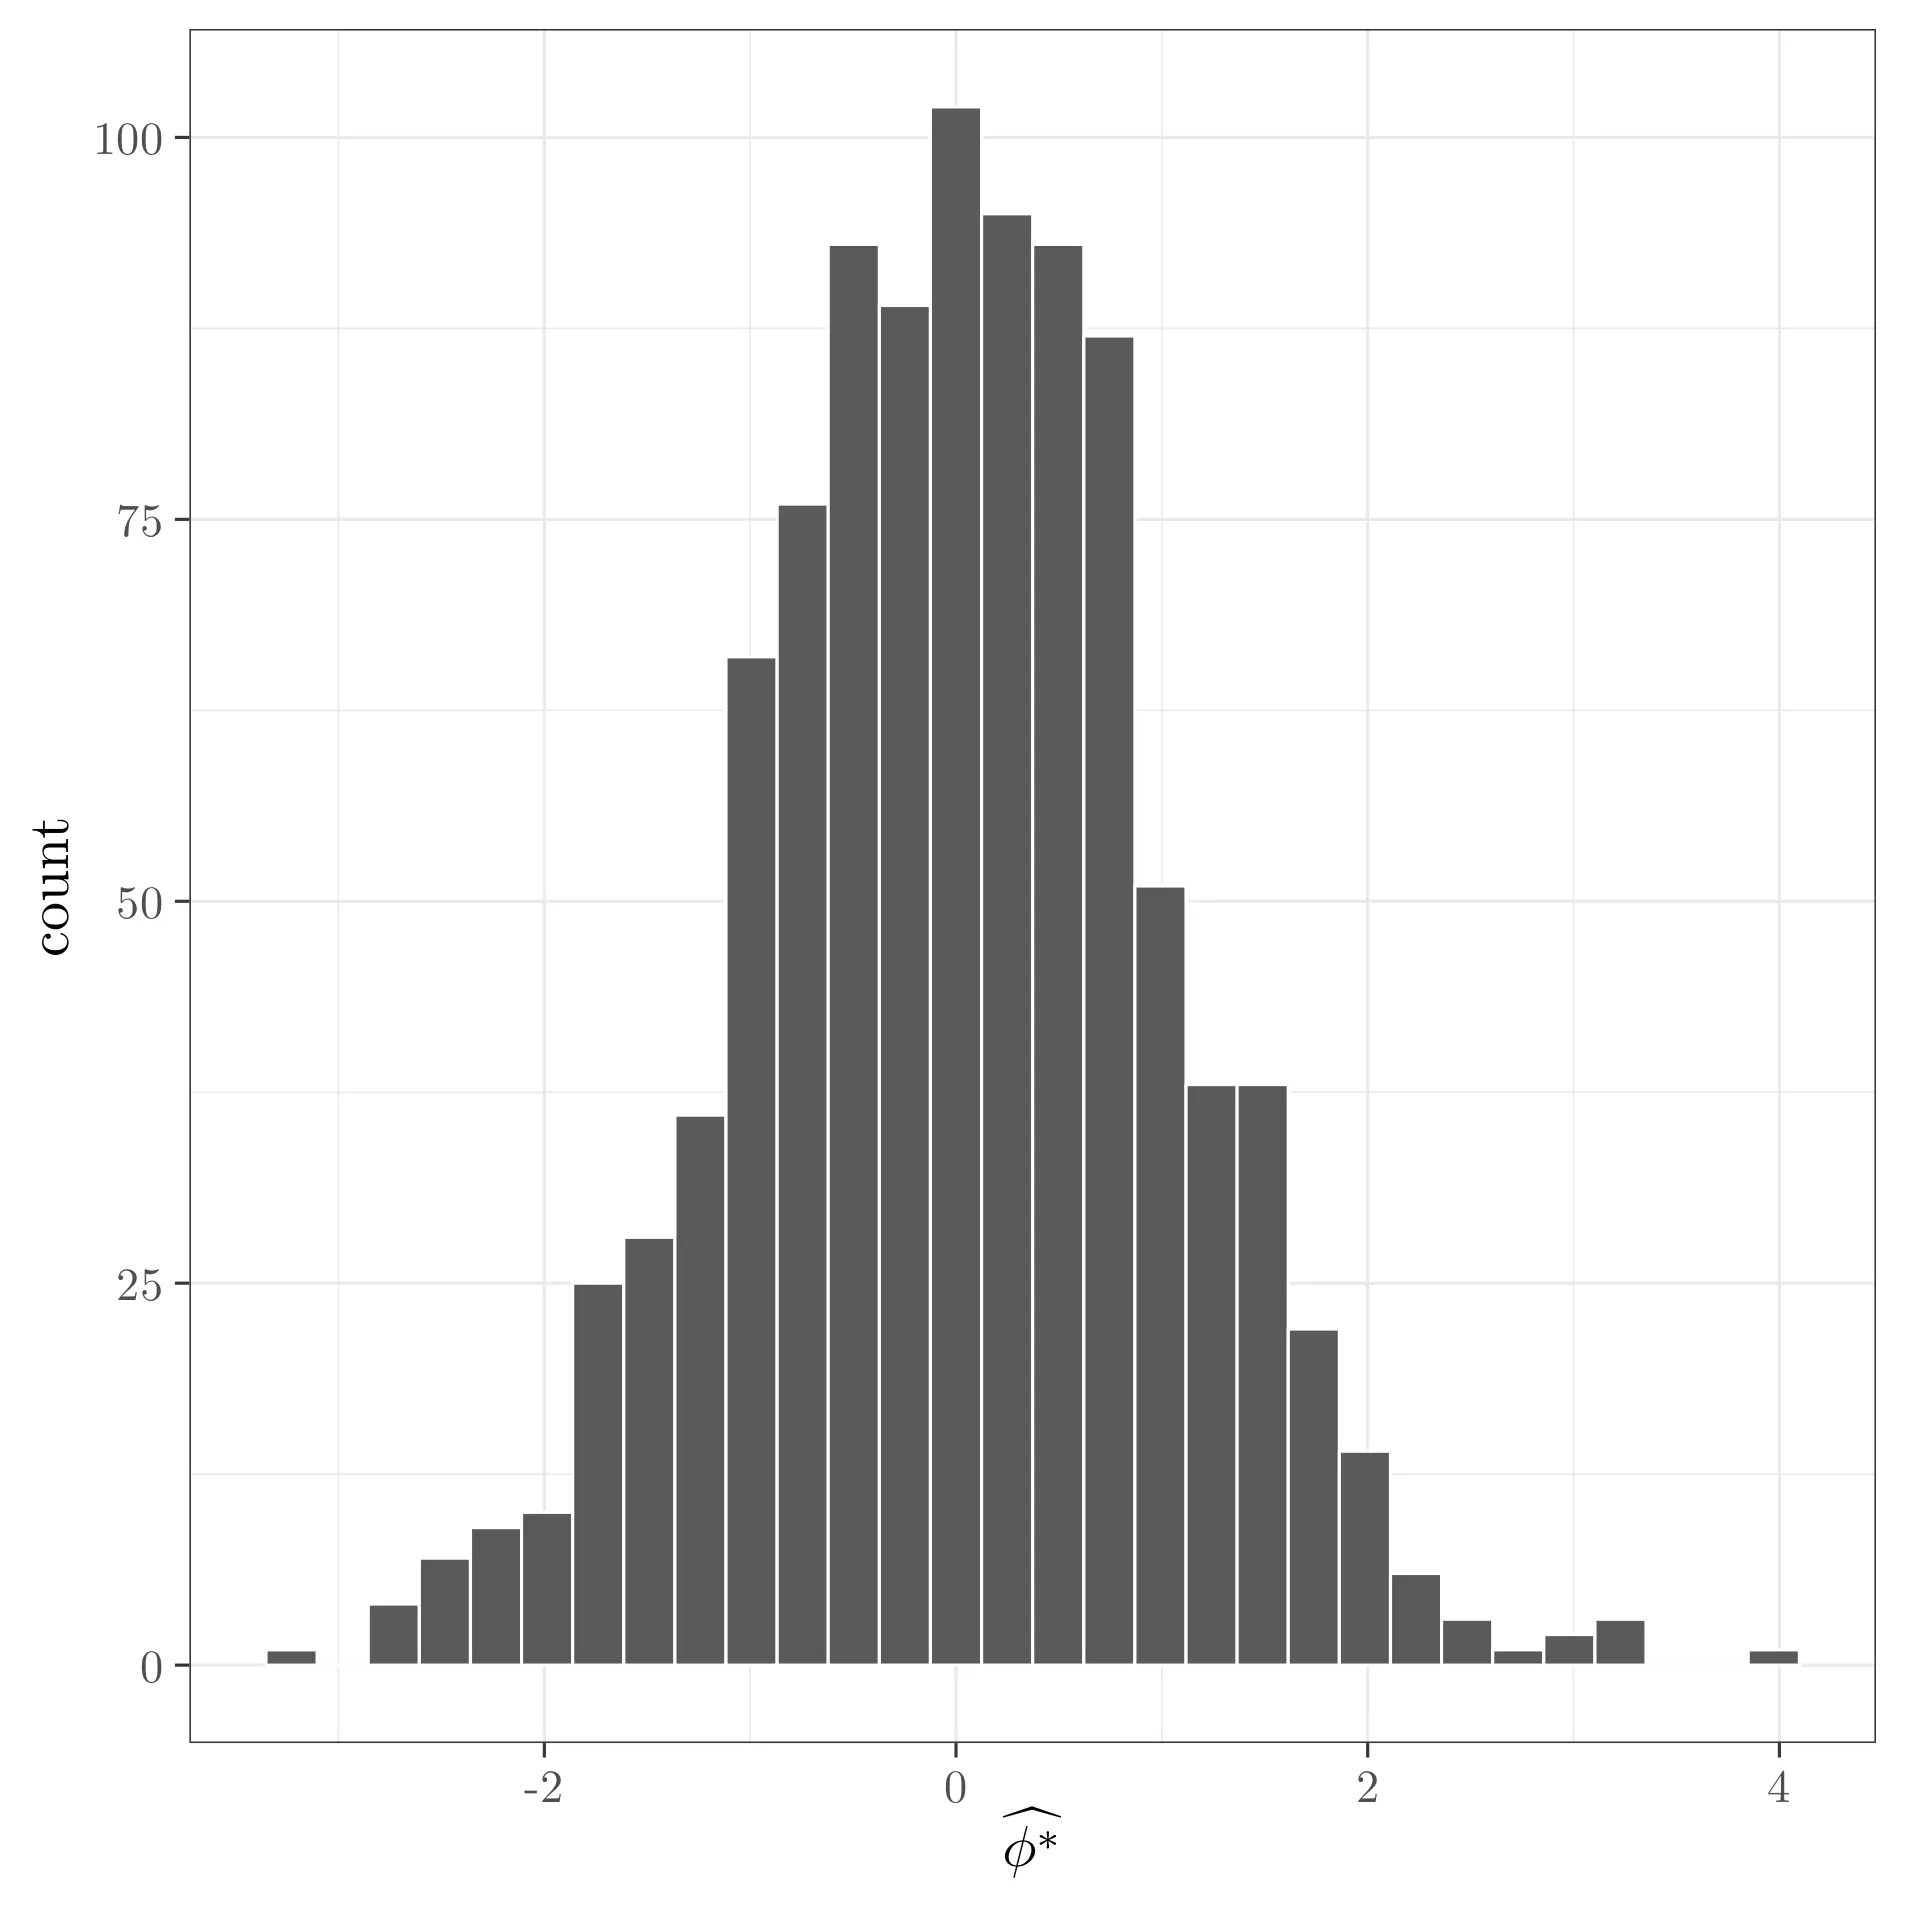
然后创建一个TeX文件,其中包含您的R绘图用“tikz”语言的“翻译”。
tikz(file = "plot_test.tex", width = 5, height = 5, standAlone = TRUE)
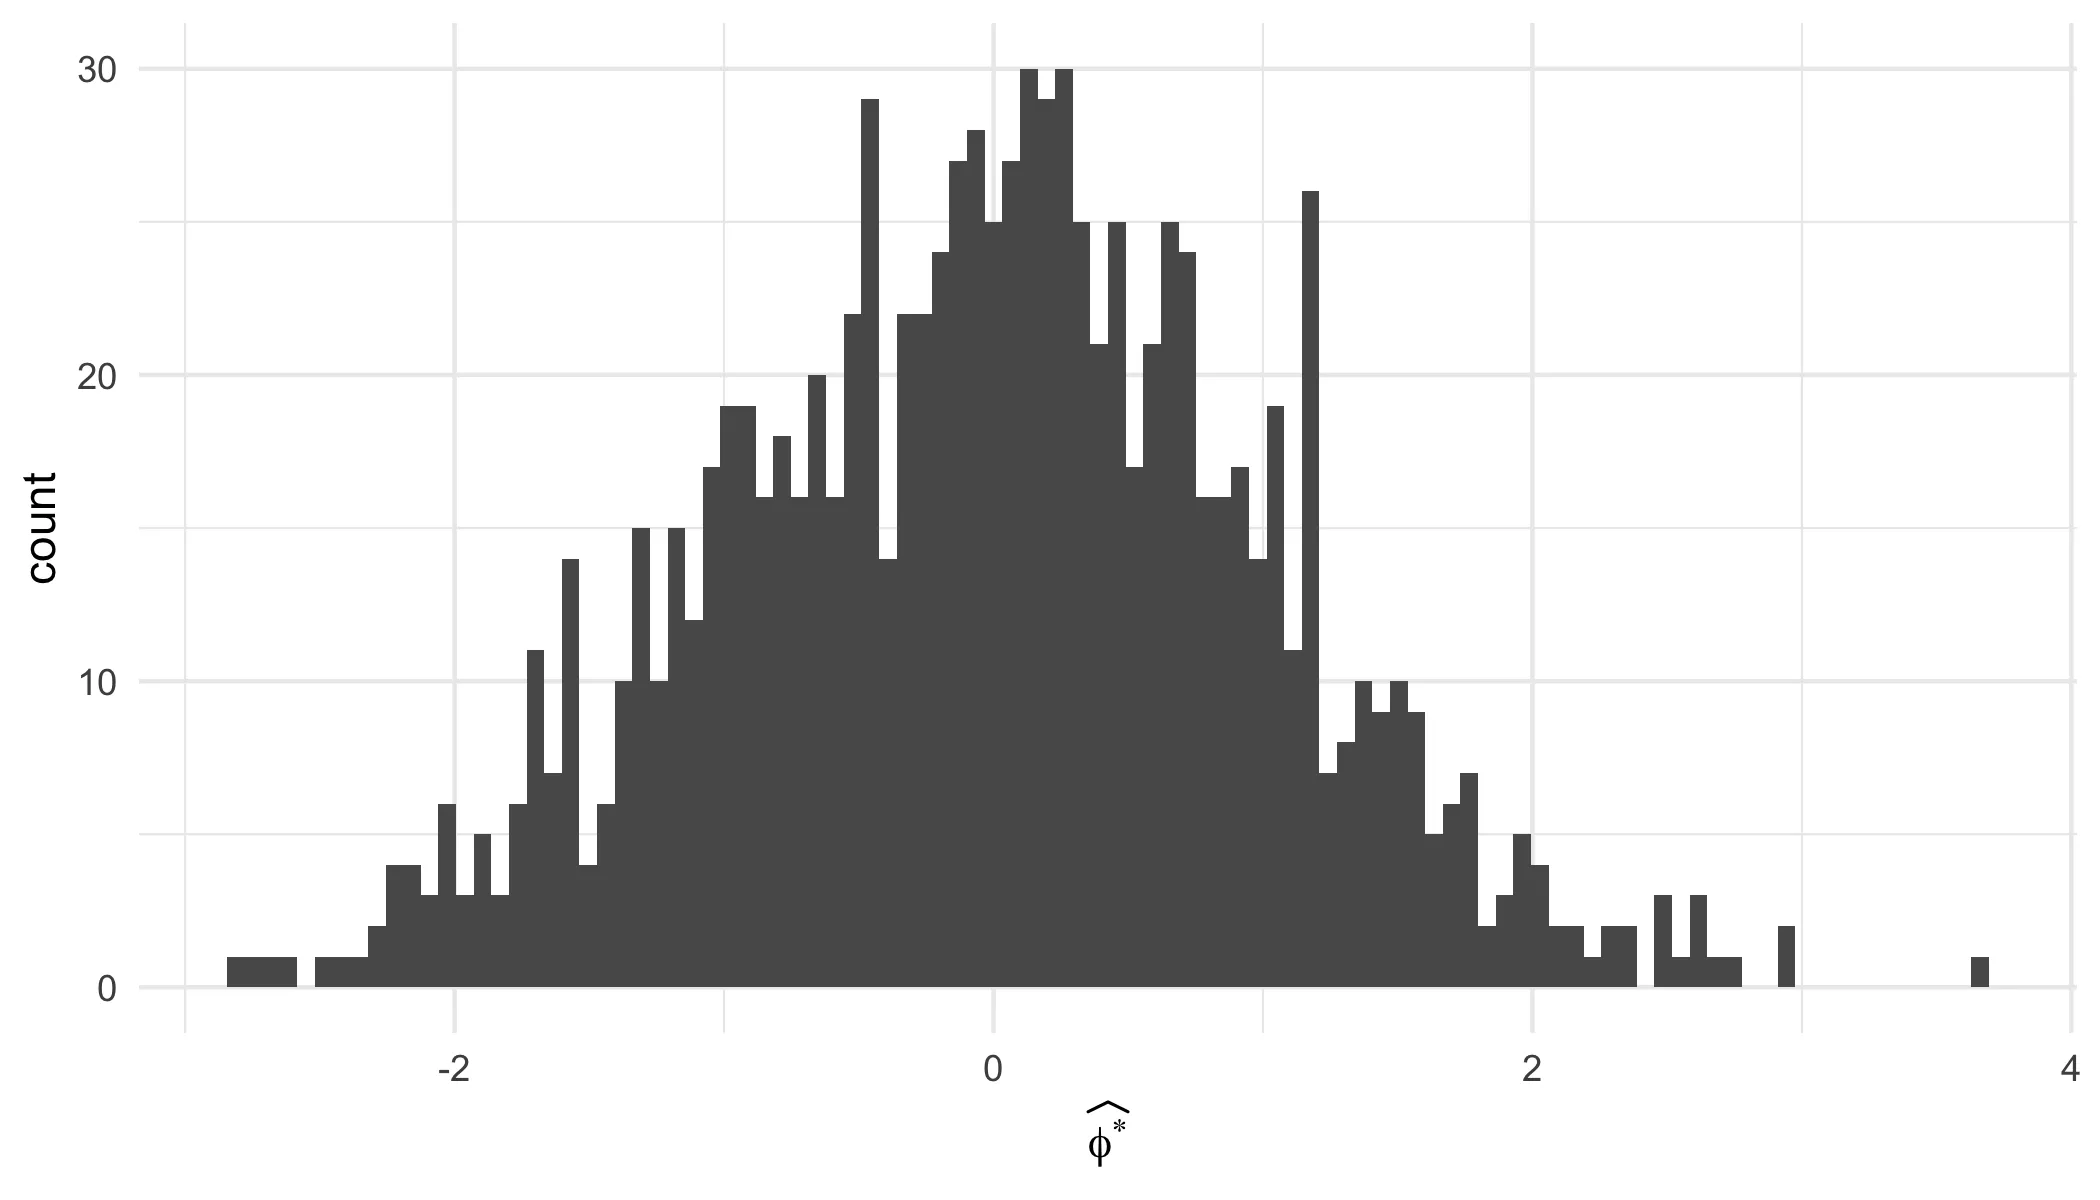
ggplot(dat, aes(x = x)) +
geom_histogram(color="white") + theme_bw() +
labs( x = "$\\widehat{\\phi^*}$")
dev.off()
然后,您可以直接复制或调用LaTeX代码到自己的LaTeX文档中(此时standAlone=TRUE参数不是必需的),或者您可以使用这两个非常有用的函数生成pdf版本并查看结果。
tools::texi2dvi("plot_test.tex", pdf=TRUE)
system(paste(getOption('pdfviewer'), "plot_test.pdf"))
expression(hat(phi^'*'))? - AntoniosK