# Import plotting routines
from pylab import *

# 1D ODE that has a pitchfork bifurcation
# x_dot = r * x - x * x * x
def PitchforkODE(r,x):
return r * x - x * x * x

# 1D Euler
def OneDEuler(r,x,f,dt):
    return x + dt * f(r,x)

# Improved 1D Euler
def ImprovedOneDEuler(r,x,f,dt):
xtemp = x + dt * f(r,x)
return x + dt * ( f(r,x) + f(r,xtemp) ) / 2.0

# 4th Order Runge-Kutta Euler Method
def RKOneD(r,x,f,dt):
k1 = dt * f(r,x)
k2 = dt * f(r,x + k1/2.0)
k3 = dt * f(r,x + k2/2.0)
k4 = dt * f(r,x + k3)
return x + ( k1 + 2.0 * k2 + 2.0 * k3 + k4 ) / 6.0

# Integrator function that calls one of the three functions
# Fills up array
def Integrator(x1,x2,x3,x4,t,N,Func,dt):
    for n in xrange(0,N):
        x1.append( Func(r,x1[n],PitchforkODE,dt) )
        x2.append( Func(r,x2[n],PitchforkODE,dt) )
        x3.append( Func(r,x3[n],PitchforkODE,dt) )
        x4.append( Func(r,x4[n],PitchforkODE,dt) )
        t.append( t[n] + dt )

# Simulation parameters
# Integration time step
dt = 0.2


# Control parameter of the pitchfork ODE:
r = 1.0

# Set up arrays of iterates for four different initital conditions
x1 = [ 0.1]
x2 = [-0.1]
x3 = [ 2.1]
x4 = [-2.1]
x5 = [ 0.1]
x6 = [-0.1]
x7 = [ 2.1]
x8 = [-2.1]
x9 = [ 0.1]
x10 = [-0.1]
x11 = [ 2.1]
x12 = [-2.1]

# Time
t  = [ 0.0]

# The number of time steps to integrate over
N = 50

#The different functions
a = OneDEuler
b = ImprovedOneDEuler
c = RKOneD

# Setup the plot
subplot(3,1,1)
Func = a
Integrator(x1,x2,x3,x4,t,N,Func,dt)
ylabel('x(t)') # set y-axis label
title(str(Func.func_name) + ': Pitchfork ODE at r= ' + str(r)) # set plot title
axis([0.0,dt*(N+1),-2.0,2.0])
# Plot the time series
plot(t,x1,'b')
plot(t,x2,'r')
plot(t,x3,'g')
plot(t,x4,'m')

subplot(212)
Func = b
Integrator(x5,x6,x7,x8,t,N,Func,dt)
ylabel('x(t)') # set y-axis label
title(str(Func.func_name) + ': Pitchfork ODE at r= ' + str(r)) # set plot title
axis([0.0,dt*(N+1),-2.0,2.0])
# Plot the time series
plot(t,x5,'b')
plot(t,x6,'r')
plot(t,x7,'g')
plot(t,x8,'m')

subplot(3,1,3)
Func = c
Integrator(x9,x10,x11,x12,t,N,Func,dt)
xlabel('Time t') # set x-axis label
ylabel('x(t)') # set y-axis label
title(str(Func.func_name) + ': Pitchfork ODE at r= ' + str(r)) # set plot title
axis([0.0,dt*(N+1),-2.0,2.0])
# Plot the time series
plot(t,x9,'b')
plot(t,x10,'r')
plot(t,x11,'g')
plot(t,x12,'m')
我正在尝试在同一个显示窗口上绘制3个不同的子图,一个在另一个上面。因此,基本上是3行1列。每个图代表不同的函数a、b或c。每个图应该有4条不同的线。
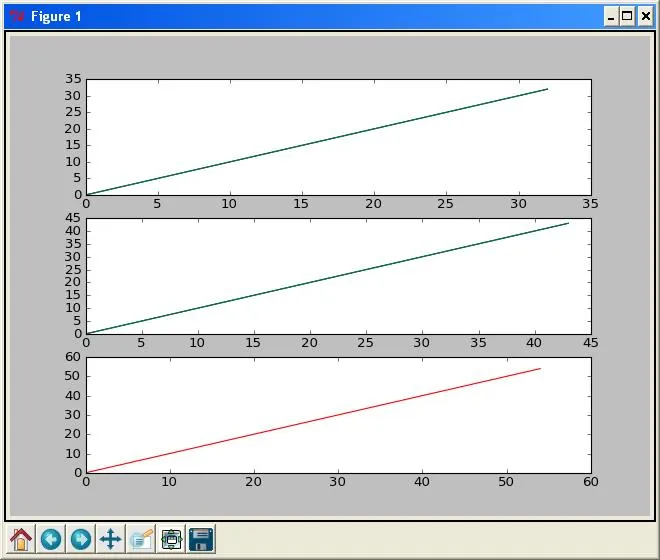
plt.subplots_adjust(hspace=1),其中hspace的值可以根据需要进行调整。 - Plug4