我发现R的默认绘图效果略显模糊。为了解决这个问题,我将Cairo设置为图形设备,现在绘图效果好多了。
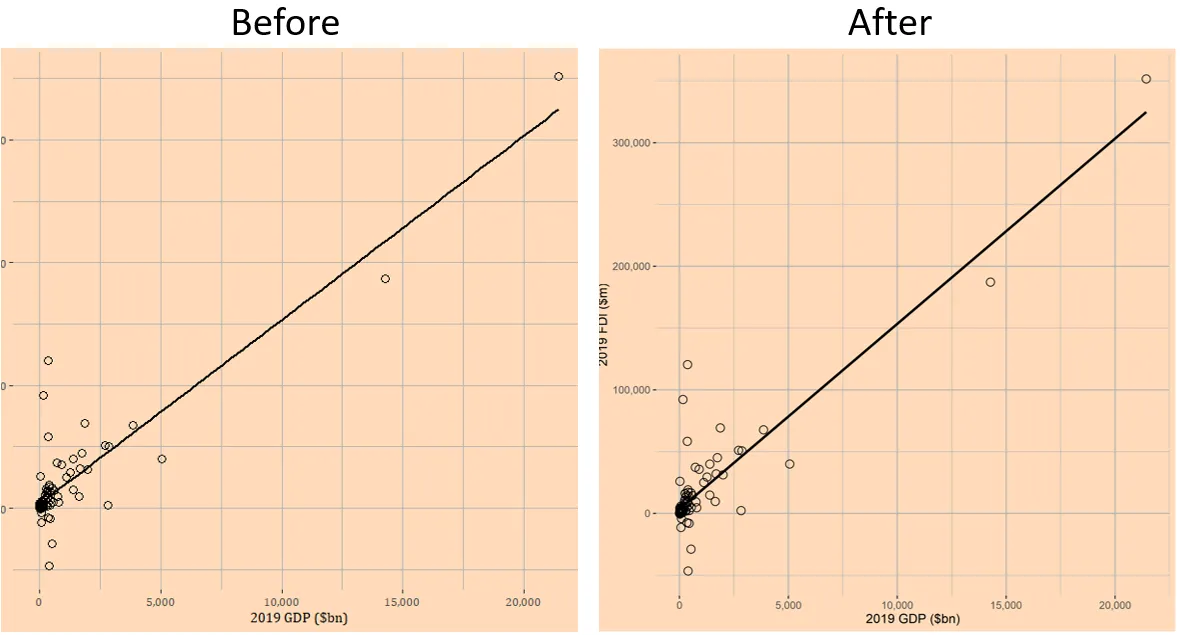
不幸的是,使用Cairo却带来了另一个问题,即由于某种原因,我无法应用在绘图窗口中使用的字体(在上面的左侧图中使用了Cambria字体,而右侧图未能应用此字体)。
以下是我的代码:
library(readxl)
library(scales)
library(ggplot2)
library(dplyr)
library('Cairo')

windowsFonts(Cam = windowsFont("Cambria"))

dataset <- read_excel('CW Data.xlsx')
colnames(dataset)[4] <- "Broadband Subs (%)"

options(scipen = 1000)

# Scatter plot FDI~GDP with regression line
CairoWin()
ggplot(dataset, aes(x=`2019 GDP ($bn)`, y=`2019 FDI ($m)`)) +
  geom_point(size=3, shape=1) +
  geom_smooth(method='lm',formula=y~x, se=FALSE, color='black') +
  scale_x_continuous(label = comma) + scale_y_continuous(label=comma) +
  theme(panel.background = element_rect(fill="peachpuff"),
        plot.background = element_rect(fill="peachpuff")) +
  theme(panel.grid.major = element_line(colour = "gray72"),
        panel.grid.minor = element_line(colour = "gray72")) +
  theme(text = element_text(family = "Cam"))

ggsave("FDI~GDP.png", device="png", type = "cairo")
这里是我使用的Excel数据的OneDrive链接
该项目可能不存在或不再可用 该项目可能已被删除、过期或您无权查看它。- IRTFMx11Fonts和windowsFonts的调用,并在下面的非答案中使用了MCVE后,无法重现。因此,我添加了[windows]标签。 我假设Cambria应该产生类似于旧式打字机输出(细的衬线等宽字体)的字体。 - IRTFM