我正在尝试在我的绘图中使用
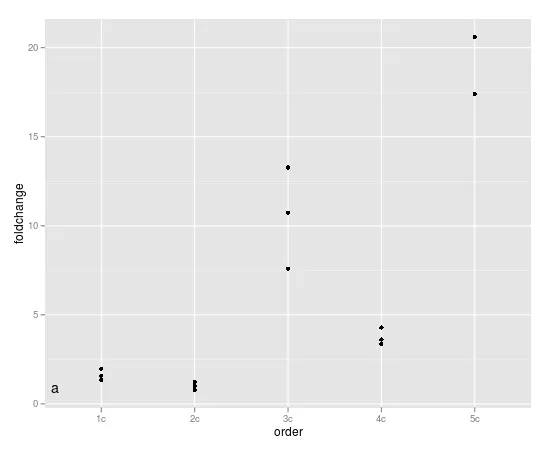
ggplot2的grid.text来添加一个文本框。 单独使用绘图没有问题,但是当我添加grid.text命令时,会出现错误“不知道如何将o添加到绘图中”。 如果我使用last_plot(),我仍然会收到错误提示,但是字母会显示在图表上 - 但无法与其余的绘图一起保存。以下是数据集和命令:foldchange order
1.583591249 1c
1.973012368 1c
1.339505031 1c
0.776845711 2c
1.004515622 2c
1.225864907 2c
13.27371225 3c
7.599476289 3c
10.74132453 3c
3.347536996 4c
4.286202467 4c
3.612756449 4c
17.40825874 5c
20.61039144 5c
ggplot(test, aes(order, foldchange)) + geom_point() #this part works fine
+ grid.text(label="a", x=.18, y=.9) + #this part gives me the error
提前感谢您!