考虑以下的
SwiftUI Charts 视图:struct ChartView: View {
var data: [DataPoint]
var body: some View {
Chart {
ForEach(data) { point in
LineMark (
x: .value("x", point.x),
y: .value("y", point.y)
)
}
.interpolationMethod(.cardinal)
}
.chartYAxis {
AxisMarks(position: .leading)
}
.chartXAxisLabel(position: .bottom, alignment: .center) {
Text("x title")
}
.chartYAxisLabel(position: .leading, alignment: .center) {
Text("y title")
}
.padding(10)
}
}
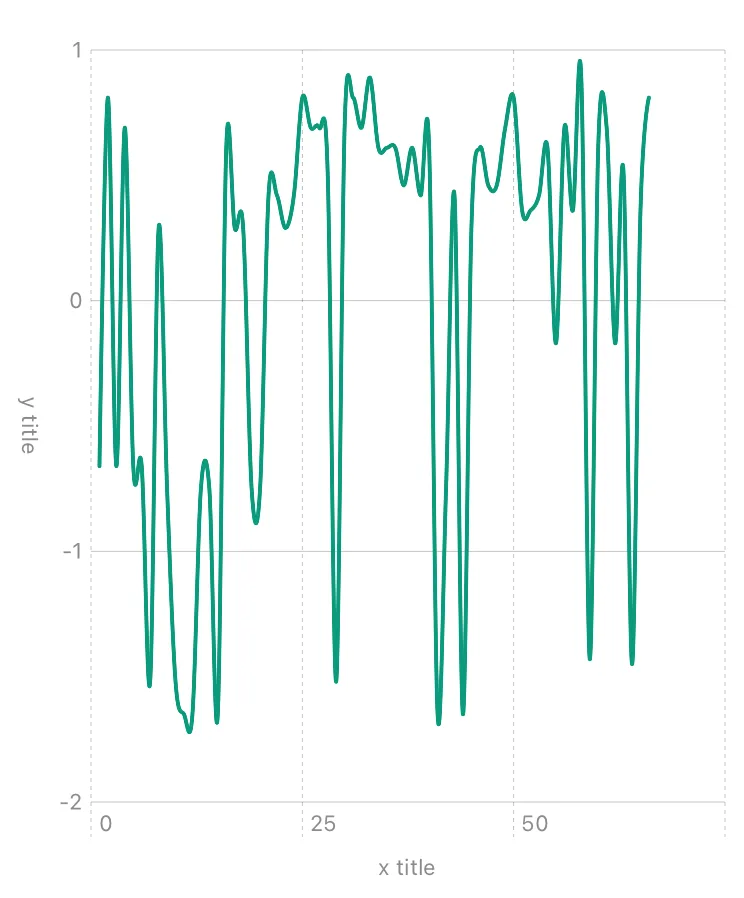
这是结果: