我在MATLAB中使用plot()函数绘制单条线。我想添加一个右侧的y轴,并用不同的刻度标记(按线性比例缩放)。这个可能吗?
6个回答
16
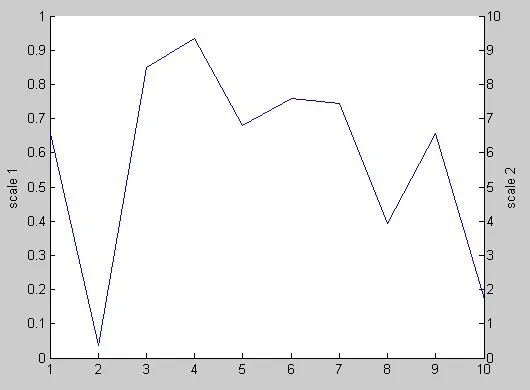
在这个相关问题上提出了许多很好的建议,虽然它们涉及到的情况比你的更加复杂。如果你想尝试一个超级简单的自助解决方案,可以尝试这个:
plot(rand(1, 10));       % Plot some random data
ylabel(gca, 'scale 1');  % Add a label to the left y axis
set(gca, 'Box', 'off');  % Turn off the box surrounding the whole axes
axesPosition = get(gca, 'Position');           % Get the current axes position
hNewAxes = axes('Position', axesPosition, ...  % Place a new axes on top...
                'Color', 'none', ...           %   ... with no background color
                'YLim', [0 10], ...            %   ... and a different scale
                'YAxisLocation', 'right', ...  %   ... located on the right
                'XTick', [], ...               %   ... with no x tick marks
                'Box', 'off');                 %   ... and no surrounding box
ylabel(hNewAxes, 'scale 2');  % Add a label to the right y axis
这是您应该得到的内容:
- gnovice
8
你可以尝试在MATLAB文件交换中心提交PLOT2AXES。
PLOT2AXES示例http://www.mathworks.com/matlabcentral/fx_files/7426/2/plot2axes.png。
- yuk
2
Jiro的解决方案很好(文件交换功能),但是它不允许使用Matlab内置的绘图函数(如条形图、散点图等),你必须使用plot2axes代替。Matlab自己的帮助文档给出了在任何类型的绘图上拥有两个轴的解决方案:
ax2 = axes('Position',get(ax1,'Position'),...
'XAxisLocation','top',...
'YAxisLocation','right',...
'Color','none',...
'XColor','k','YColor','k');
请参考:http://www.mathworks.com/help/techdoc/creating_plots/f1-11215.html
- Mam
1
您所引用的页面已不存在。 - Fraukje
2
从Matlab 2016版本开始,有一个选项可以定义在哪个轴上绘制:
yyaxis left
plots...
yyaxis right
plots...
source: https://se.mathworks.com/help/matlab/ref/yyaxis.html
- IceQueeny
0
在绘制左轴图后,我能够使用以下内容完成它:
yyaxis right
ylabel('Right axis label')
plot(x,y1) % plot your right axis graph
希望能有所帮助。
- Mcrave20
网页内容由stack overflow 提供, 点击上面的可以查看英文原文,
原文链接
原文链接