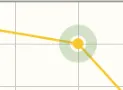
有没有一种方法可以将多种不同的效果添加到标记中?
我知道有线条、颜色和阴影属性,这些都可以帮助我尝试创建以下设计,但是我已经失败了两个小时,什么也没有想出来!
seriesDefaults: {
    lineWidth: 50,
    color: 'yellow',
    markerRenderer: $.jqplot.MarkerRenderer,
    markerOptions: {
        show: true,
        style: 'circle',
        color: 'white',
        lineWidth: 4,
        size: 25,
        shadow: true,
        shadowAngle: 0,
        shadowOffset: 0,
        shadowDepth: 1,
        shadowAlpha: 0.07
    }
}
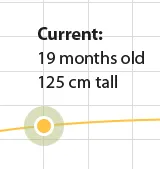
我觉得我需要以下属性:
markerBackgroundColor,markerShadowSize才能达到我的效果。我可以用CSS3做些什么吗?比如创建自己的标记符号并对其进行样式设置。