使用GeoPandas将点几何对象转换为线几何对象

5

我有一个地理数据框 gdf,它看起来像这样:

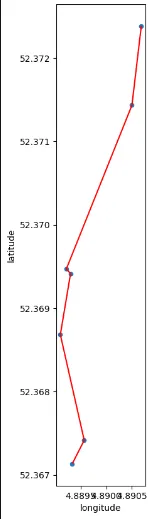
        longitude   latitude    geometry
8628    4.890683    52.372383   POINT (4.89068 52.37238)
8629    4.890500    52.371433   POINT (4.89050 52.37143)
8630    4.889217    52.369469   POINT (4.88922 52.36947)
8631    4.889300    52.369415   POINT (4.88930 52.36942)
8632    4.889100    52.368683   POINT (4.88910 52.36868)
8633    4.889567    52.367416   POINT (4.88957 52.36742)
8634    4.889333    52.367134   POINT (4.88933 52.36713)

我试图将这些点几何体转换成线。然而,下面的代码会报错: AttributeError: 'Point'对象没有'values'属性

line_gdf = gdf['geometry'].apply(lambda x: LineString(x.values.tolist()))
line_gdf = gpd.GeoDataFrame(line_gdf, geometry='geometry')

有什么想法吗?
2个回答

6

当你从geodataframe中所有的点创建一个LineString时,你只会得到一条线。以下是你可以运行的代码来创建LineString

from shapely.geometry import LineString

# only relevant code here
# use your gdf that has Point geometry
lineStringObj = LineString( [[a.x, a.y] for a in gdf.geometry.values] )

如果您需要将此linestring作为其几何图形的geodataframe的1行,请按照以下步骤进行:
import pandas as pd
import geopandas as gpd

line_df = pd.DataFrame()
line_df['Attrib'] = [1,]
line_gdf = gpd.GeoDataFrame(line_df, geometry=[lineStringObj,])

编辑1

Pandas拥有强大的聚合函数,可用于收集所有坐标(经度、纬度),供LineString()使用以创建所需的几何形状。

我提供这个可运行的代码,以演示这种方法,使读者受益。

import pandas as pd
import geopandas as gpd
from shapely.geometry import LineString
from shapely import wkt
from io import StringIO
import numpy as np

# Create a dataframe from CSV data
df5 = pd.read_csv(StringIO(
"""id longitude latitude
8628  4.890683  52.372383
8629  4.890500  52.371433
8630  4.889217  52.369469
8631  4.889300  52.369415
8632  4.889100  52.368683
8633  4.889567  52.367416
8634  4.889333  52.367134"""), sep="\s+")

# Using pandas' aggregate function
# Aggregate longitude and latitude
stack_lonlat = df5.agg({'longitude': np.stack, 'latitude':  np.stack})
# Create the LineString using aggregate values
lineStringObj = LineString(list(zip(*stack_lonlat)))

# (Previously use) Create a lineString from dataframe values
#lineStringObj = LineString( list(zip(df5.longitude.tolist(), df5.latitude.tolist())) )
# Another approach by @Phisan Santitamnont may be the best.

# Create a geodataframe `line_gdf` for the lineStringObj
# This has single row, containing the linestring created from aggregation of (long,lat) data
df6 = pd.DataFrame()
df6['LineID'] = [101,]
line_gdf = gpd.GeoDataFrame(df6, crs='epsg:4326', geometry=[lineStringObj,])

# Plot the lineString in red
ax1 = line_gdf.plot(color="red", figsize=[4,10]);
# Plot the original data: "longitude", "latitude" as kind="scatter"
df5.plot("longitude", "latitude", kind="scatter", ax=ax1);

output


2
先生,截至2022年,我想提出另一种更新的Pythonic风格...
# Create a dataframe from CSV data
df = pd.read_csv(StringIO(
"""id longitude latitude
8628  4.890683  52.372383
8629  4.890500  52.371433
8630  4.889217  52.369469
8631  4.889300  52.369415
8632  4.889100  52.368683
8633  4.889567  52.367416
8634  4.889333  52.367134"""), sep="\s+")

ls = LineString( df[['longitude','latitude']].to_numpy() )
line_gdf = gpd.GeoDataFrame( [['101']],crs='epsg:4326', geometry=[ls] )

# Plot the lineString in red
ax = line_gdf.plot(color="red", figsize=[4,10]);
df.plot("longitude", "latitude", kind="scatter", ax=ax);
plt.show()

网页内容由stack overflow 提供, 点击上面的
可以查看英文原文,
原文链接