我想在shiny的DT::datatable中合并某一列的几行数据,这是否可行?
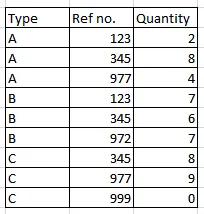
目前我的输出结果看起来像这样:
但是理想情况下,我想合并这些行,并希望输出结果看起来像这样:
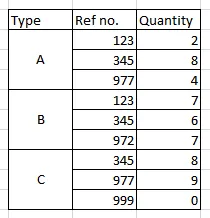
在DT::datatable中是否能够像这样合并行数呢?
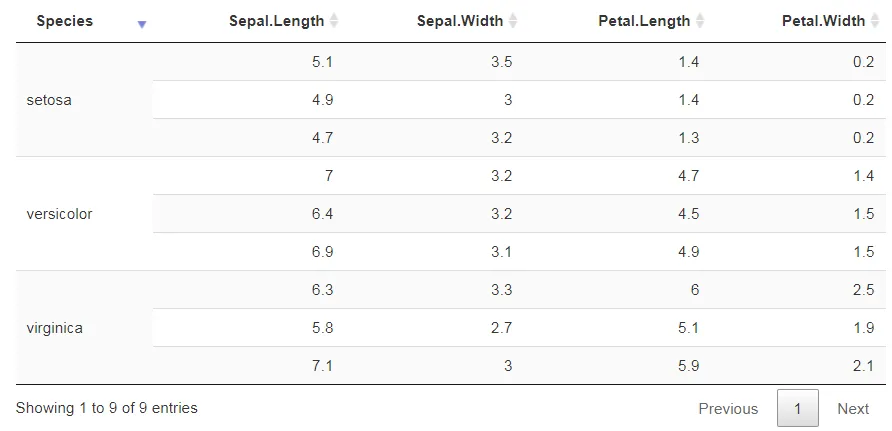
借助于 datatables-rowsgroup 库,这是一个示例:
library(shiny)
library(DT)

dat <- iris[c(1,2,3,51,52,53,101,102,103), c(5,1,2,3,4)]

ui <- fluidPage(
  DTOutput("table")
)

server <- function(input, output){
  output[["table"]] <- renderDT({
    dtable <- datatable(dat, rownames = FALSE,
                        options = list(
                          rowsGroup = list(0) # merge cells of column 1
                        ))
    path <- "U:/Data/shiny/DT/www" # folder containing dataTables.rowsGroup.js
    dep <- htmltools::htmlDependency(
      "RowsGroup", "2.0.0",
      path, script = "dataTables.rowsGroup.js")
    dtable$dependencies <- c(dtable$dependencies, list(dep))
    dtable
  })
}

shinyApp(ui, server)
嘿,据我所知,在DT中无法实现这一点,但我有另一种方法可以实现。
最初的回答
 kable(c, align = "c") %>%
  kable_styling(bootstrap_options = "striped", full_width = F, position = "left",font_size = 12)%>%
  column_spec(1, bold = T) %>%
  collapse_rows(columns = 1, valign = "middle")