Matplotlib比例文本(花括号)

4
我希望我的图表中使用不同高度但相同宽度的花括号 '}'。到目前为止,当调整文本大小时,宽度会按比例缩放:
import matplotlib.pyplot as plt
fig = plt.figure()
ax = fig.add_axes([0, 0, 1, 1])
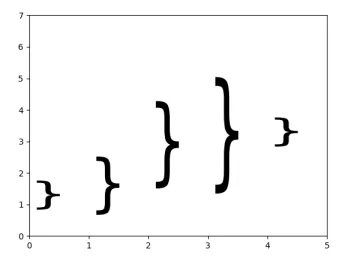
ax.text(0.2, 0.2, '}', fontsize=20)
ax.text(0.4, 0.2, '}', fontsize=40)
plt.show()

我想到的唯一方法是在 matplotlib 图像上覆盖括号的图像,例如使用 svgutils,类似于导入 svg 文件到 matplotlib 图形,但这样很繁琐。

输出矢量图形的解决方案是理想的。


我曾认为使用 LaTeX 文本渲染和 \scalebox 可以解决这个问题,但是似乎不起作用 - tmdavison
1个回答

7
要在一个维度上缩放,例如高度保持不变,可以使用TextPath创建花括号。这可以作为PathPatch的输入提供。而PathPatch可以使用matplotlib.transforms任意缩放。
import matplotlib.transforms as mtrans
from matplotlib.text import TextPath
from matplotlib.patches import PathPatch

import matplotlib.pyplot as plt
fig, ax = plt.subplots()

def curly(x,y, scale, ax=None):
    if not ax: ax=plt.gca()
    tp = TextPath((0, 0), "}", size=1)
    trans = mtrans.Affine2D().scale(1, scale) + \
        mtrans.Affine2D().translate(x,y) + ax.transData
    pp = PathPatch(tp, lw=0, fc="k", transform=trans)
    ax.add_artist(pp)

X = [0,1,2,3,4]
Y = [1,1,2,2,3]
S = [1,2,3,4,1]

for x,y,s in zip(X,Y,S):
    curly(x,y,s, ax=ax)

ax.axis([0,5,0,7])
plt.show()

enter image description here


这个函数能否适应在图形外部绘制括号?例如,绘制在右侧? - jonboy
3
当然,你只需要将“clip_path”关闭即可。 - ImportanceOfBeingErnest
谢谢。感谢@ImportanceOfBeingErnest的支持。 - jonboy
1
以防万一今天有人像我一样偶然发现这个问题,这里有一个非常好的包由高思宇博士发布,比回答这个问题时更加模块化。 它比重新排列文本字符串要好得多,请参阅文档/存储库中的示例。 https://github.com/iruletheworld/matplotlib-curly-brace 文档:https://matplotlib-curly-brace.readthedocs.io/en/latest/index.html我希望它能像对我一样对其他人有所帮助! - DouglasCoenen

网页内容由stack overflow 提供, 点击上面的
可以查看英文原文,
原文链接