在HTML画布上绘制一条垂直于另一条线的直线

4
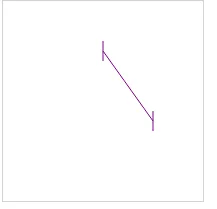
我正在使用HTML画布来绘制线条,如下图所示,但是这条线在两侧有棱角。

enter image description here

如图所示,两个边缘不垂直于主线。
我尝试了以下解决方案,但没有成功:
* 旋转边缘线,但旋转会将它们从原始位置转换
* 找到主线的角度,然后根据该线绘制线条,但这个解决方案不容易实现(很可能我实现错误)。

这是我的代码,但它总是绘制垂直的边缘:

<!DOCTYPE html>
<html>
<body>

<canvas id="myCanvas" width="200" height="200" style="border:1px solid #d3d3d3;">

<script>

var c = document.getElementById("myCanvas");
var ctx = c.getContext("2d");

var x1 = 100;
var x2 = 150;
var y1 = 50;
var y2 = 120;

ctx.beginPath();
ctx.strokeStyle = "purple";  // Purple path
ctx.moveTo(x1,y1);
ctx.lineTo(x2,y2);            
ctx.stroke();  // Draw it

ctx.beginPath();
ctx.moveTo(x1,y1);
ctx.lineTo(x1,y1+10);
ctx.stroke();


ctx.restore();
ctx.beginPath();
ctx.moveTo(x1,y1);
ctx.lineTo(x1,(y1-10));
ctx.stroke();


ctx.beginPath();
ctx.moveTo(x2,y2);
ctx.lineTo(x2,y2+10);
ctx.stroke();


ctx.restore();
ctx.beginPath();
ctx.moveTo(x2,y2);
ctx.lineTo(x2,(y2-10));
ctx.stroke();


</script>
</body>
</html>

有人能帮我旋转这两条边线,使它们垂直于主要线吗?谢谢。


1
基于您的第二个解决方案:https://dev59.com/FXXYa4cB1Zd3GeqP3ClW#17989593 - Teemu
画一条垂直于另一条线的线需要旋转90度。这不需要三角学 - 这是一个简单的几何变换。请参见此处的已接受答案:https://dev59.com/FnM_5IYBdhLWcg3ww2AQ - enhzflep
@Teemu - 如果你使用三角函数来画垂直线,那么你的方法是错误的。 ;) - enhzflep
这是一个通用解决方案,以防下一个问题是“如何将边缘线旋转32.5度”... - Teemu
@Teemu - 当然,我能理解你的想法。不过,那将是一个不同的问题,有着不同的答案。 ;) - enhzflep
4个回答

10

旋转任意2D向量90度

如果您记得2D向量的旋转90度规则,则可以简单计算垂线。

向量{x,y}可以沿顺时针方向旋转90度{-y,x}或逆时针方向旋转90度{y,-x}。交换x和y,并对顺时针旋转或逆时针旋转的y取反,对于逆时针旋转则取反的是x。

因此,对于线段x1y1x2y2,请将其转换为向量,对该向量进行归一化处理,并按以下方式旋转90度:

function getPerpOfLine(x1,y1,x2,y2){ // the two points can not be the same
    var nx = x2 - x1;  // as vector
    var ny = y2 - y1;
    const len = Math.sqrt(nx * nx + ny * ny);  // length of line
    nx /= len;  // make one unit long
    ny /= len;  // which we call normalising a vector
    return [-ny, nx]; // return the normal  rotated 90 deg
}

假设你想在线段的两端画出一条长度为10像素的线。

const canvas = document.createElement("canvas");
const ctx = canvas.getContext("2d");
document.body.append(canvas);
ctx.strokeStyle = "black";
ctx.lineJoin = ctx.lineCap = "round";
ctx.lineWidth = 3;

// the line segment
const x1 = 40, y1 = 40, x2 = 260, y2 = 110;
const endLen = 10; // length of end lines

var px = y1 - y2; // as vector at 90 deg to the line
var py = x2 - x1;
const len = endLen / Math.hypot(px, py);
px *= len;  // make leng 10 pixels
py *= len; 

// draw line the start cap and end cap.
ctx.beginPath();

ctx.lineTo(x1, y1);   // the line start
ctx.lineTo(x2, y2);
ctx.moveTo(x1 + px, y1 + py); // the start perp line
ctx.lineTo(x1 - px, y1 - py);
ctx.moveTo(x2 + px, y2 + py); // the end perp line
ctx.lineTo(x2 - px, y2 - py);
ctx.stroke();

更新

渲染沿着一条线的内容的简单方法,使用相同的90度规则。

有一种使用相同向量旋转的替代渲染方法,但不是通过向量乘法设置垂直轴线,而是将变换的y轴设置为与沿线的x轴垂直的90度。将原点设置为该线的起点,您可以简单地相对于该线进行渲染。

setTransformToLine(x1, y1, x2, y2)

以下功能将设置画布变换沿着该线。

// Set 2D context  current transform along the line x1,y1,x2,y2 and origin to
// start of line. y Axis is rotated clockwise 90 from the line.
// Returns the line length as that is most frequently required when
// using the method saving some time.
function setTransformToLine(x1, y1, x2, y2) {
  const vx = x2 - x1;   // get the line as vector
  const vy = y2 - y1;
  const len = Math.hypot(vx, vy); // For <= IE11 use Math.sqrt(vx * vx + vy * vy)
  const nx = vx / len; // Normalise the line vector. Making it one
  const ny = vy / len; // pixel long. This sets the scale

  // The transform is the normalised line vector for x axis, y at 90 deg 
  // and origin at line start
  ctx.setTransform(nx, ny, -ny, nx, x1, y1); // set transform

  return len;
}

如何使用

这个例子展示了如何使用transform来在同一行上添加注释长度。

const canvas = document.createElement("canvas");
const ctx = canvas.getContext("2d");
document.body.append(canvas);
ctx.strokeStyle = "black";
ctx.lineJoin = ctx.lineCap = "round";
ctx.lineWidth = 3;
ctx.font = "16px arial";
ctx.textBaseline = "middle";
ctx.textAlign = "center";

const x1 = 40, y1 = 40, x2 = 260, y2 = 110;
const endLen = 10; 


function setTransformToLine(x1, y1, x2, y2) {
  const vx = x2 - x1; 
  const vy = y2 - y1;
  const len = Math.hypot(vx, vy); 
  const nx = vx / len; 
  const ny = vy / len;
  ctx.setTransform(nx, ny, -ny, nx, x1, y1);
  return len;
}

// Set the transform along the line. Keep the line length
// line len is need to get the x coord of the end of the line
const lineLen = setTransformToLine(x1, y1, x2, y2);

const lineLenStr = Math.round(lineLen) + "px";
const textWidth = ctx.measureText(lineLenStr).width;

const rlen = lineLen - textWidth - 16; // find the remaining line len after removing space for text

// Rendering is done in line local coordinates
// line is from (0,0) to (lineLen,0)

// Now draw the line the ends first and then along the line leaving gap for text
ctx.beginPath();
ctx.lineTo(0, -endLen);             // start perp line
ctx.lineTo(0,  endLen); 

ctx.moveTo(lineLen, -endLen);       // end of line is at lineLen
ctx.lineTo(lineLen,  endLen); 

ctx.moveTo(0,0);                    // line start segment
ctx.lineTo(rlen / 2, 0);

ctx.moveTo(lineLen - rlen / 2,0);   // line end segment
ctx.lineTo(lineLen, 0);

ctx.stroke(); // render it.

// now add text at the line center
ctx.fillText(lineLenStr, lineLen / 2, 0);

// To restore the transform to its default use identity matrix
ctx.setTransform(1, 0, 0, 1, 0, 0);


好的并简短的答案 - Shashi3456643

2

你只需要计算原始线条的斜率,即 (y2 - y1)/(x2 - x1),然后使用它来斜置原始边缘的新线条。这里有一个简单的例子:

var c = document.getElementById("myCanvas");
var ctx = c.getContext("2d");

var x1 = 100;
var x2 = 150;
var y1 = 50;
var y2 = 120;

ctx.beginPath();
ctx.strokeStyle = "purple"; // Purple path
ctx.moveTo(x1, y1);
ctx.lineTo(x2, y2);
ctx.stroke(); // Draw it

var slope = (y2 - y1) / (x2 - x1);

ctx.beginPath();
ctx.lineTo(x1 + slope * 4, y1 - slope * 4);
ctx.lineTo(x1 - slope * 4, y1 + slope * 4);
ctx.stroke();

ctx.beginPath();
ctx.lineTo(x2 - slope * 4, y2 + slope * 4);
ctx.lineTo(x2 + slope * 4, y2 - slope * 4);
ctx.stroke();
<canvas id="myCanvas" width="200" height="200" style="border:1px solid #d3d3d3;">

请注意,这更多是一个数学理论问题,因此示例仅展示如何实现此操作的思路。您应该花些时间阅读更多关于数学和几何的内容,以完美地实现此背后的逻辑。
另外,值得一提的是,您的代码已经被简化了,因为一些垂直线段的绘制调用是冗余的,可以合并。

1
这不会产生正确的结果。尝试将x2设置为120并运行。 - user1693593
@K3N 这就是为什么我建议研究这背后的数学。你需要计算出斜率,以及理解你所处圆的哪一部分(或类似的内容),才能正确地画出垂直线。在这里解释数学会占用太多空间,而且据我所知,这个网站并不是专门用来讲解数学的。 - Angelos Chalaris
这些线不是垂直的。我不知道你的代码有什么问题,但是这些线之间的角度约为85度或接近这个值。你可以通过使用一条斜率不接近45度的线来明显地看到这一点,将第一条线更改为更垂直或更水平。只有当斜率恰好为45度或-45度时,你的代码才能给出正确的解决方案。 - AnnanFay

2

像这样的吗?

结果

var canvas = document.getElementById('canvas');
var c      = canvas.getContext('2d');

//save orientation of context
c.save();

// Rotate the plane of the drawing context around centre.
// The canvas is defined in HTML as 100x100 so centre is at 50, 50
c.translate(50, 50);
c.rotate(45 * Math.PI / 180); //45°
c.translate(-50, -50);

//draw as if your lines were parallel to the X & Y axes
c.beginPath();
c.moveTo(20, 45);
c.lineTo(20, 55);
c.stroke();

c.beginPath();
c.moveTo(20, 50);
c.lineTo(80, 50);
c.stroke();

c.beginPath();
c.moveTo(80, 45);
c.lineTo(80, 55);
c.stroke();

//restore context to original orientation
c.restore()
canvas {background: lime;}
<canvas id="canvas" width="100" height="100">
</canvas>


2

您可以找到第一条线的斜率(请参见下面的代码),然后找到垂直的斜率,再沿着这些线移动(如下所示)。

ctx.beginPath();
ctx.clearRect(0, 0, canvas.width, canvas.height);
ctx.moveTo(firstPoint.x, firstPoint.y);
ctx.lineTo(secondPoint.x, secondPoint.y);

const slope = getSlope(firstPoint, secondPoint);
const perpSlope = getPerpSlope(slope);

let perpPointOne = findPointOnLine(firstPoint, perpSlope, 10);
let perpPointTwo = findPointOnLine(firstPoint, perpSlope, -10);

ctx.moveTo(perpPointOne.x, perpPointOne.y);
ctx.lineTo(perpPointTwo.x, perpPointTwo.y);

perpPointOne = findPointOnLine(secondPoint, perpSlope, 10);
perpPointTwo = findPointOnLine(secondPoint, perpSlope, -10);

ctx.moveTo(perpPointOne.x, perpPointOne.y);
ctx.lineTo(perpPointTwo.x, perpPointTwo.y);

ctx.stroke();

function getSlope(pointA, pointB)
{
    return (pointB.y - pointA.y) / (pointB.x - pointA.x);
}

function getPerpSlope(slope)
{
  return -1 / slope;
}

function findPointOnLine(startPoint, slope, distance)
{
    const newPoint = { };

    if (slope === 0) {
       newPoint.x = startPoint.x + distance; 
       newPoint.y = startPoint.y; 

    } else if (slope === Infinity) {

       newPoint.x = startPoint.x; 
       newPoint.y = startPoint.y + distance; 

    } else { 

       dx = (distance / Math.sqrt(1 + (slope * slope))); 
       dy = slope * dx; 

       newPoint.x = startPoint.x + dx; 
       newPoint.y = startPoint.y + dy; 
    }
    return newPoint;
}

1
当perpSlope获得-Infinity值时,线条不可见。为了解决这个问题,需要将(slope === Infinity)更改为(slope === Infinity)||(slope === -Infinity)。 - Vaibhav Shaha
解决方案适用于konvajs线条。上面的其余部分不适用。 - Ajit T Stephen

网页内容由stack overflow 提供, 点击上面的
可以查看英文原文,
原文链接