用Python绘制3D截锥形图形

4

我想使用与在Matplotlib中绘制以平面为中心的实心圆柱体相同的方法来绘制截锥体;该方法在已知底部中心上的两个点和半径时绘制圆柱体。另一方面,当已知其底部中心上的两个点的坐标和每个底部的半径时,我想绘制一个截锥体。看起来我只需要更改以下程序中绘制圆柱体的倒数第二行,但是我尝试了很多次都无法做到。

import numpy as np
from mpl_toolkits.mplot3d import Axes3D
from scipy.linalg import norm 
import pylab as pllt

fig = pllt.figure()
ax = fig.add_subplot(1,1,1, projection='3d')
#ax = pllt.subplot2grid((2,2), (0,0), rowspan=2, projection='3d')
#axis and radius


def cylinder(p0,p1,R,ccc):
 #vector in direction of axis
 v = p1 - p0
 #find magnitude of vector
 mag = norm(v)
 #unit vector in direction of axis
 v = v / mag
 #make some vector not in the same direction as v
 not_v = np.array([1, 1, 0])
 if (v == not_v).all():
    not_v = np.array([0, 1, 0])
 #make vector perpendicular to v
 n1 = np.cross(v, not_v)
 #print n1,'\t',norm(n1)
 #normalize n1
 n1 /= norm(n1)
 #make unit vector perpendicular to v and n1
 n2 = np.cross(v, n1)
 #surface ranges over t from 0 to length of axis and 0 to 2*pi
 t = np.linspace(0, mag, 80)
 theta = np.linspace(0, 2 * np.pi, 80)
 #use meshgrid to make 2d arrays
 t, theta = np.meshgrid(t, theta)
 #generate coordinates for surface
 X, Y, Z = [p0[i] + v[i] * t + R * np.sin(theta) * n1[i] + R * np.cos(theta) * n2[i] for i in [0, 1, 2]]
 ax.plot_surface(X, Y, Z,color=ccc,linewidth=0, antialiased=False)


A0 = np.array([1, 3, 2])
A1 = np.array([8, 5, 9])
ax.set_xlim(0,10)
ax.set_ylim(0,10)
ax.set_zlim(0,10)
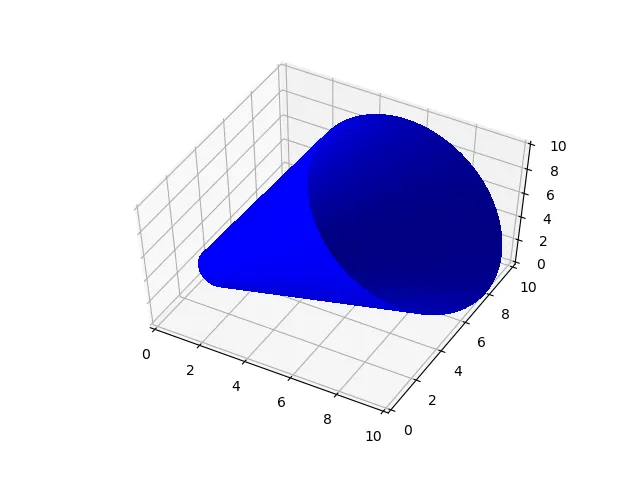
cylinder(A0,A1,1,'blue')
pllt.show()

我认为我应该按照http://mathworld.wolfram.com/ConicalFrustum.html中提到的v=p1-p0的函数来改变半径,以便能够完成此操作。 如果有任何方法,请告诉我。

1个回答

6

将半径从恒定的R改为从R0R1变化:

R = np.linspace(R0, R1, n)

import numpy as np
from mpl_toolkits.mplot3d import Axes3D
from scipy.linalg import norm
import pylab as plt

fig = plt.figure()
ax = fig.add_subplot(1, 1, 1, projection='3d')


def truncated_cone(p0, p1, R0, R1, color):
    """
    Based on https://stackoverflow.com/a/39823124/190597 (astrokeat)
    """
    # vector in direction of axis
    v = p1 - p0
    # find magnitude of vector
    mag = norm(v)
    # unit vector in direction of axis
    v = v / mag
    # make some vector not in the same direction as v
    not_v = np.array([1, 1, 0])
    if (v == not_v).all():
        not_v = np.array([0, 1, 0])
    # make vector perpendicular to v
    n1 = np.cross(v, not_v)
    # print n1,'\t',norm(n1)
    # normalize n1
    n1 /= norm(n1)
    # make unit vector perpendicular to v and n1
    n2 = np.cross(v, n1)
    # surface ranges over t from 0 to length of axis and 0 to 2*pi
    n = 80
    t = np.linspace(0, mag, n)
    theta = np.linspace(0, 2 * np.pi, n)
    # use meshgrid to make 2d arrays
    t, theta = np.meshgrid(t, theta)
    R = np.linspace(R0, R1, n)
    # generate coordinates for surface
    X, Y, Z = [p0[i] + v[i] * t + R *
               np.sin(theta) * n1[i] + R * np.cos(theta) * n2[i] for i in [0, 1, 2]]
    ax.plot_surface(X, Y, Z, color=color, linewidth=0, antialiased=False)


A0 = np.array([1, 3, 2])
A1 = np.array([8, 5, 9])
ax.set_xlim(0, 10)
ax.set_ylim(0, 10)
ax.set_zlim(0, 10)
truncated_cone(A0, A1, 1, 5, 'blue')
plt.show()

enter image description here


非常感谢,这个完美地运行了! :) - shredEngineer

网页内容由stack overflow 提供, 点击上面的
可以查看英文原文,
原文链接