如何为Chart.js工具提示标签设置颜色

3
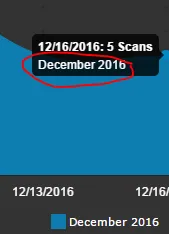
在Chart.js中,我无法为工具提示设置颜色。我想将标签“2016年12月”的颜色设置为与图例(蓝色)相同的颜色。

enter image description here

请见下方;
graphOptions.tooltips = {
                    enabled: true,
                    mode: 'single',
                    displayColors: false,
                    callbacks: {
                        title: function (tooltipItem, data) {
                            if (tooltipItem.length > 0) {
                                return tooltipItem[0].xLabel + ': ' + tooltipItem[0].yLabel +" Scans";
                            }
                            return "";
                        },
                        label: function (tooltipItem, data) {
                            if (data.datasets.length > 0) {
                                return data.datasets[tooltipItem.datasetIndex].label;
                            }
                            return '';
                        },
                        labelColor: function (tooltipItem, chartInstace) {
                            if (data.length > 0) {
                                return data[tooltipItem.datasetIndex].backgroundColor;
                            }
                        }
                    }
                };
6个回答

7
您在`labelColor`回调函数中没有定义任何名为`data`的内容。对于charts.js中的这个回调函数还有一个困惑是,传递给`labelColor`回调函数的第二个参数是图表实例,而不是其他一些chartjs回调函数所传递的数据集。无论如何,这应该可以解决问题。
    labelColor: function(tooltipItem, chart) {
        var dataset = chart.config.data.datasets[tooltipItem.datasetIndex];
        return {
            backgroundColor : dataset.backgroundColor
        }
    }

2

工具提示没有labelTextColor属性。我认为适当的选项应该是bodyFontColor。 - funkysoul
自Chartjs 2.7版本以来,现在有以下功能(特性#4199): https://github.com/chartjs/Chart.js/releases/tag/v2.7.0 - Alvin Chipmunk

1
labelTextColor: function(tooltipItem, chart) {
   if (chart.tooltip._data.datasets[tooltipItem.datasetIndex].label === "amount") 
      {
           return "#1ff368";
       }
   if (chart.tooltip._data.datasets[tooltipItem.datasetIndex].label ==="transactions") {
                return "#8577ec";
              }
            }

只需像“金额”一样输入您的图表标签,然后手动修改颜色。


0

实际上,如果您的数据集颜色只是一个项而不是一个数组,那么您就不需要额外的工具提示回调函数。

单个颜色会自动显示为提示中所示的颜色

const myDataset = {
    label: 'My dataset',
    data: [1,2.3,4,-5],
    fill: true,
    // this will show the tooltip with red color
    backgroundColor: '#e23944',
    borderColor: 'blue'
}

而不是

颜色数组未被解释为工具提示中所显示的颜色

const myDataset = {
    label: 'My dataset',
    data: [1,2.3,4,-5],
    fill: true,
    // need to remove the array of color here
    backgroundColor: ['#e23944'],
    borderColor: ['blue']
}

根据屏幕截图,您只有一个与颜色匹配的数据集,所以不需要将颜色作为数组放置。如果您需要在同一数据集中设置多个点,并使用不同的颜色,则应该使用
每个数据点分配的颜色数组
const myDataset = {
    label: 'My dataset',
    data: [1,2.3,4,-5],
    fill: true,
    // need to remove the array of color here
    backgroundColor: ['#e23944', '#D4E157', '#26A69A', '#758BE2'],
    borderColor: ['blue', 'green', 'white', 'dark']
}

但是你应该忘记这个解决方案^^并采用上面给出的解决方案;)

PS:对于边框和背景颜色,您可以使用十六进制、RGB或字符串表示法。

希望能帮到你:)


0

实际上,问题在于在 labelColor 回调函数中,您返回了 backgroundColor。以下是上述回调方法的正确返回类型。

function (tooltipItem, chartInstance) {
                return {
                    borderColor: borderColor,
                    backgroundColor: backgroundColor
                };
            }

在backgroundColor中为标签分配颜色。您可以保留borderColor。

[示例代码]

labelColor : function(tooltipItem, chartInstance){
                    return {
                        backgroundColor : data.datasets[tooltipItem.datasetIndex].backgroundColor[0]
                    };
                }

这个问题之前问过,但是……有任何想法为什么不起作用吗?如果我在“tooltips {...}”中设置backgroundColor,则可以设置它,但是使用回调函数中的函数则不起作用,即使我硬编码特定颜色也是如此。有任何想法吗? - Windmill
data 怎么不是未定义的? - Shaya Ulman

-2
"tooltipItem" 不存在,最后的 "s" 拼错了。因此,你的代码应该是:
labelColor : function(tooltipItem, chartInstance){
    return {
        backgroundColor : data.datasets[tooltipItems.datasetIndex].backgroundColor[0]
    };
}

网页内容由stack overflow 提供, 点击上面的
可以查看英文原文,
原文链接