5个回答
189
如果你使用的是 chart.js 2.x 版本,只需在刻度选项中设置 maxRotation: 90 和 minRotation: 90。这对我很有效!如果你想显示所有 x 轴标签,可以设置 autoSkip: false。以下是示例。
var myChart = new Chart(ctx, {
    type: 'bar',
    data: chartData,
    options: {
        scales: {
            xAxes: [{
                ticks: {
                    autoSkip: false,
                    maxRotation: 90,
                    minRotation: 90
                }
            }]
        }
    }
});
- tabetomo
2
2直接进入我正在寻找的配置设置! - Suresh Prajapati
3请注意,对于 chart.js 3.x 版本,选项格式已更改,因此需要删除上面第6行和第12行中的方括号。 - Martin CR
24
在3.1.0版本上对我有效。
var myChart = new Chart(ctx, {
    type: 'bar',
    data: chartData,
    options: {
        scales: {
            x: {
                ticks: {
                    maxRotation: 90,
                    minRotation: 90
                }
            }
        }
    }
})
- Alan Lins
13
使用此代码设置x轴
 options: {
      legend: {
        display: false
      },
      scales: {
        xAxes: [
          {
          ticks: {
                autoSkip: false,
                maxRotation: 0,
                minRotation: 0
            }
          }
        ]
      }
    }
并且可以使用 for 循环过滤标签:
      arrayLabels.forEach((date, i) => {
    let label = "";
    if (i % step == 0 && fecha) {
      label = moment(date, "DD/MM").format("DD MMM");
    }
    labels.push(label);
  });
   chartOptions.data.labels = labels;
- Edgar Olivar
3
此答案适用于 chartjs 1.X,如需覆盖2.X,请查看 @tabetomo 的完美答案:https://dev59.com/ulsW5IYBdhLWcg3wZWjj#39706986
与前面的答案相同,唯一需要改变的是图表类型的扩展方式。这次它是扩展线性图表,并且设置有点不同,因为线图比例尺是在构建比例尺中创建的,所以这次要覆盖
与前面的答案相同,唯一需要改变的是图表类型的扩展方式。这次它是扩展线性图表,并且设置有点不同,因为线图比例尺是在构建比例尺中创建的,所以这次要覆盖
buildScale,以便使用自定义比例尺,并且可以传入新选项 overrideRotation。同时还要覆盖 initialize,但只是为了调用 super initialize 并开始构建图形。
var helpers = Chart.helpers;
Chart.MyScale = Chart.Scale.extend({
  calculateXLabelRotation: function() {
    //Get the width of each grid by calculating the difference
    //between x offsets between 0 and 1.

    this.ctx.font = this.font;

    var firstWidth = this.ctx.measureText(this.xLabels[0]).width,
      lastWidth = this.ctx.measureText(this.xLabels[this.xLabels.length - 1]).width,
      firstRotated,
      lastRotated;


    this.xScalePaddingRight = lastWidth / 2 + 3;
    this.xScalePaddingLeft = (firstWidth / 2 > this.yLabelWidth + 10) ? firstWidth / 2 : this.yLabelWidth + 10;

    this.xLabelRotation = 0;
    if (this.display) {
      var originalLabelWidth = helpers.longestText(this.ctx, this.font, this.xLabels),
        cosRotation,
        firstRotatedWidth;
      this.xLabelWidth = originalLabelWidth;
      //Allow 3 pixels x2 padding either side for label readability
      var xGridWidth = Math.floor(this.calculateX(1) - this.calculateX(0)) - 6;

      if (this.overrideRotation) {
        this.xLabelRotation = this.overrideRotation;
        cosRotation = Math.cos(helpers.radians(this.xLabelRotation));
        // We're right aligning the text now.
        if (firstRotated + this.fontSize / 2 > this.yLabelWidth + 8) {
          this.xScalePaddingLeft = firstRotated + this.fontSize / 2;
        }
        this.xScalePaddingRight = this.fontSize / 2;
        this.xLabelWidth = cosRotation * originalLabelWidth;
      } else {
        //Max label rotate should be 90 - also act as a loop counter
        while ((this.xLabelWidth > xGridWidth && this.xLabelRotation === 0) || (this.xLabelWidth > xGridWidth && this.xLabelRotation <= 90 && this.xLabelRotation > 0)) {
          cosRotation = Math.cos(helpers.radians(this.xLabelRotation));

          firstRotated = cosRotation * firstWidth;
          lastRotated = cosRotation * lastWidth;

          // We're right aligning the text now.
          if (firstRotated + this.fontSize / 2 > this.yLabelWidth + 8) {
            this.xScalePaddingLeft = firstRotated + this.fontSize / 2;
          }
          this.xScalePaddingRight = this.fontSize / 2;


          this.xLabelRotation++;
          this.xLabelWidth = cosRotation * originalLabelWidth;

        }
      }
      if (this.xLabelRotation > 0) {
        this.endPoint -= Math.sin(helpers.radians(this.xLabelRotation)) * originalLabelWidth + 3;
      }
    } else {
      this.xLabelWidth = 0;
      this.xScalePaddingRight = this.padding;
      this.xScalePaddingLeft = this.padding;
    }

  },

});

Chart.types.Line.extend({
  name: "MyLine",
  initialize: function(data) {
    Chart.types.Line.prototype.initialize.apply(this, arguments);
  },

  buildScale: function(labels) {
    var self = this;

    var dataTotal = function() {
      var values = [];
      self.eachPoints(function(point) {
        values.push(point.value);
      });

      return values;
    };

    var scaleOptions = {
      templateString: this.options.scaleLabel,
      height: this.chart.height,
      width: this.chart.width,
      ctx: this.chart.ctx,
      textColor: this.options.scaleFontColor,
      offsetGridLines: this.options.offsetGridLines,
      fontSize: this.options.scaleFontSize,
      fontStyle: this.options.scaleFontStyle,
      fontFamily: this.options.scaleFontFamily,
      valuesCount: labels.length,
      beginAtZero: this.options.scaleBeginAtZero,
      integersOnly: this.options.scaleIntegersOnly,
      calculateYRange: function(currentHeight) {
        var updatedRanges = helpers.calculateScaleRange(
          dataTotal(),
          currentHeight,
          this.fontSize,
          this.beginAtZero,
          this.integersOnly
        );
        helpers.extend(this, updatedRanges);
      },
      xLabels: labels,
      font: helpers.fontString(this.options.scaleFontSize, this.options.scaleFontStyle, this.options.scaleFontFamily),
      lineWidth: this.options.scaleLineWidth,
      lineColor: this.options.scaleLineColor,
      showHorizontalLines: this.options.scaleShowHorizontalLines,
      showVerticalLines: this.options.scaleShowVerticalLines,
      gridLineWidth: (this.options.scaleShowGridLines) ? this.options.scaleGridLineWidth : 0,
      gridLineColor: (this.options.scaleShowGridLines) ? this.options.scaleGridLineColor : "rgba(0,0,0,0)",
      padding: (this.options.showScale) ? 0 : this.options.pointDotRadius + this.options.pointDotStrokeWidth,
      showLabels: this.options.scaleShowLabels,
      display: this.options.showScale,
      overrideRotation: this.options.overrideRotation,
    };

    if (this.options.scaleOverride) {
      helpers.extend(scaleOptions, {
        calculateYRange: helpers.noop,
        steps: this.options.scaleSteps,
        stepValue: this.options.scaleStepWidth,
        min: this.options.scaleStartValue,
        max: this.options.scaleStartValue + (this.options.scaleSteps * this.options.scaleStepWidth)
      });
    }


    this.scale = new Chart.MyScale(scaleOptions);
  },
});


var randomScalingFactor = function() {
  return Math.round(Math.random() * 100)
};

var barChartData = {
  labels: ["January", "February", "March", "April", "May", "June", "July"],
  datasets: [{
    fillColor: "rgba(20,20,220,0.2)",
    strokeColor: "rgba(20,20,220,1)",
    pointColor: "rgba(20,20,220,1)",
    pointStrokeColor: "#fff",
    pointHighlightFill: "#fff",
    pointHighlightStroke: "rgba(20,20,220,1)",
    data: [randomScalingFactor(), randomScalingFactor(), randomScalingFactor(), randomScalingFactor(), randomScalingFactor(), randomScalingFactor(), randomScalingFactor()]
  }, {
    fillColor: "rgba(120,120,120,0.2)",
    strokeColor: "rgba(120,220,120,1)",
    pointColor: "rgba(120,120,120,1)",
    pointStrokeColor: "#fff",
    pointHighlightFill: "#fff",
    pointHighlightStroke: "rgba(120,120,120,1)",
    data: [randomScalingFactor(), randomScalingFactor(), randomScalingFactor(), randomScalingFactor(), randomScalingFactor(), randomScalingFactor(), randomScalingFactor()]
  }, {
    fillColor: "rgba(220,220,220,0.2)",
    strokeColor: "rgba(220,220,220,1)",
    pointColor: "rgba(220,220,220,1)",
    pointStrokeColor: "#fff",
    pointHighlightFill: "#fff",
    pointHighlightStroke: "rgba(220,220,220,1)",
    data: [randomScalingFactor(), randomScalingFactor(), randomScalingFactor(), randomScalingFactor(), randomScalingFactor(), randomScalingFactor(), randomScalingFactor()]
  }]

}
window.onload = function() {
  var ctx = document.getElementById("canvas").getContext("2d");
  window.myBar = new Chart(ctx).MyLine(barChartData, {
    overrideRotation: 90
  });
}<script src="http://www.chartjs.org/assets/Chart.min.js"></script>
<canvas id="canvas" height="150" width="300"></canvas>- Quince
2
感谢您的解决方案Quince。您是否注意到,在您的代码片段中,当工具提示显示时,图例的背景颜色并没有改变为描边颜色?如果我理解正确,它们应该显示
datasets[i].strokeColor。我在使用Chart.js示例时注意到了这一点。 - Delcon@Delcon,抱歉这是因为我使用了之前的示例,该示例设置了条形图数据,而错过了线形图属性。已更新为实际的线形图设置。 - Quince
2
这是稍微“hackier”(非正式的)版本(Quince 的回答更好-以下内容可能会在 Chart.js 的未来实现中以不同方式进行
小提琴 - http://jsfiddle.net/gc5gdg7e/
calculateXLabelRotation),标签旋转是通过逐步旋转标签来计算的,使它们适合垂直网格线之间的空间 - 这些空间使用 scale.calculateX(1) - scale.calculateX(0) 进行计算。我们在正确的位置进入,强制使此计算结果为 0(通过使 scale.calculateX 返回相同的值),从而将旋转强制到最大(即 90 度)。
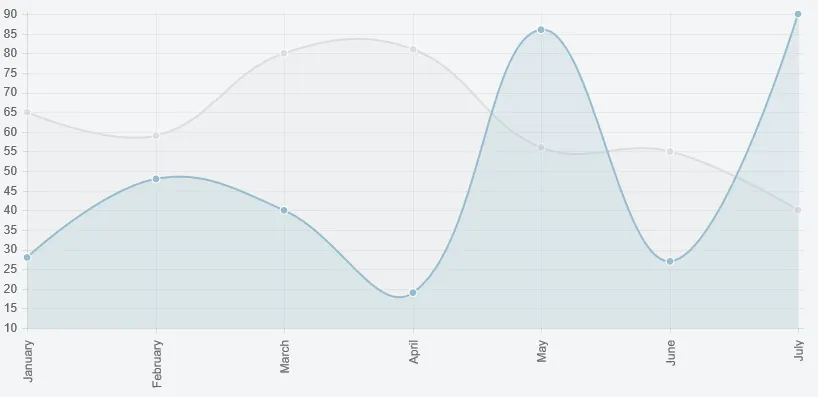
预览
Script
Chart.types.Line.extend({
    name: "LineAlt",
    initialize: function () {
        Chart.types.Line.prototype.initialize.apply(this, arguments);

        var scale = this.scale;
        var originalCalculateXLabelRotation = scale.calculateXLabelRotation;
        var originalXScalePaddingLeft = scale.xScalePaddingLeft;
        scale.calculateXLabelRotation = function () {
            var originalCalculateX = scale.calculateX;
            scale.calculateX = function () {
                return 0;
            }
            originalCalculateXLabelRotation.apply(this, arguments);
            scale.xScalePaddingLeft = originalXScalePaddingLeft;
            scale.calculateX = originalCalculateX;
        }
        this.scale.fit();
    }
});
然后
...
new Chart(ctx).LineAlt(data);
小提琴 - http://jsfiddle.net/gc5gdg7e/
- potatopeelings
网页内容由stack overflow 提供, 点击上面的可以查看英文原文,
原文链接
原文链接