Jqplot中为两个系列数据设置不同颜色条

5

我想知道如何在Jqplot中为两个系列制作不同颜色的条形图。如果我只有一个系列数据,它可以完美地工作,就像下面的图片一样。
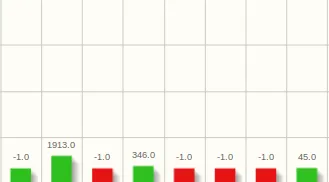
alt text

红色和绿色是基于其值而定的。

但是如果我有两个系列的数据,我无法配置每个系列数据的两个系列颜色。到目前为止,我只能制作这个图表

alt text

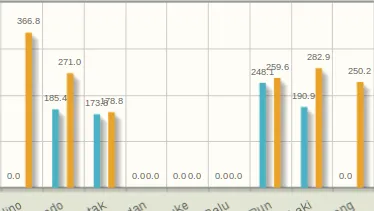
我希望两个系列的图表也可以根据其值具有不同的颜色,就像单个系列的图表一样。

这是我的代码

chart = $.jqplot('map-chart', [dataChart, dataChart2], {
        title: 'TIME',
        legend: {
            renderer: $.jqplot.EnhancedLegendRenderer,
                        show: true,
                        location: 'ne'
        },
        series: [{label: 'Current data'}, {label: 'Worst data'}],
        //seriesColors: seriesColors1,
        seriesDefaults:{
            renderer:$.jqplot.BarRenderer,
            pointLabels: {show: true}
            //rendererOptions:{
             //varyBarColor: true
            //}
        },
        axes: {
            xaxis: {
                label: 'station',
                renderer: $.jqplot.CategoryAxisRenderer,
                labelRenderer: $.jqplot.CanvasAxisLabelRenderer,
                tickRenderer: $.jqplot.CanvasAxisTickRenderer,
                ticks: tickers,
                tickOptions: {
                    angle: -30
                }
            },
            yaxis: {
              min: 0,
              label: 'Time',
              labelRenderer: $.jqplot.CanvasAxisLabelRenderer,
              tickOptions: {
                    fontSize: '8pt'
              }
            }
        },
        highlighter: {show: false}
    });

我尝试过使用 seriesColors : [seriesColors1, seriesColors2],但它没有起作用。

2个回答

9

基本上,您需要创建一个包含每个条目的字典的系列数组,并具有seriesColors条目。下面是一个工作示例,可以在以下jsfiddle中查看:

plot1 = $.jqplot('chart1', [[50,100,50,50,75],[80,70,50,50,40]], 
{
        seriesDefaults:{
            renderer:$.jqplot.BarRenderer,
            rendererOptions:{ varyBarColor : true }
        },
        series: [
            {seriesColors: [ "#f00", "#4b0", "#b40", '#ff0', '#fb0']}, 
            {seriesColors: ["#a30", "#4b0", "#b40", '#af0', '#fa0']}
            ],
        highlighter: { show: false }
});

如果我修改外部js文件,该小提琴可能会停止工作;jsfiddle默认情况下没有jqplot库。

谢谢JimBob博士...等了这么久终于看到答案了。真的有效。 :) - deerawan

0
今天我遇到了这个问题,正如jimbob博士所预测的那样,所有外部文件都已经失效。我找到了一个CDN网站,并更新了fiddle到最新的jQuery和JQPlot资源文件,可以在这里找到:http://jsfiddle.net/delliottg/WLbGt/96/ 只是为了满足JSFiddle cop在SO上的要求,让我发布这篇文章:
//this is not my code, it's only here to satisfy the SO require that fiddles have
// code associated with them
plot1 = $.jqplot('chart1', [[50,100,50,50,75],[80,70,50,50,40]], {
        seriesDefaults:{
            renderer:$.jqplot.BarRenderer,
            rendererOptions:{ varyBarColor : true }
        },
    series: [
            {seriesColors: [ "#f00", "#4b0", "#b40", '#ff0', '#fb0']}, 
            {seriesColors: ["#00f",  "#b0b", "#a30", "#4b0", '#af0']}
            ],
        highlighter: { show: false }
});

我与小提琴本身无关,我只是更新了它,使其正常工作。希望这可以帮助到某些人(结果发现它不是我要找的,但你付钱,自然冒风险)。


网页内容由stack overflow 提供, 点击上面的
可以查看英文原文,
原文链接