我在使用Cartopy重新投影图像时遇到了问题。
我有以下代码(修改自这里的示例):
import os
import matplotlib.pyplot as plt

from cartopy import config
import cartopy.crs as ccrs
import cartopy.feature as cfeature

fig = plt.figure(figsize=(8, 10))

img_extent = (-120.67660000000001, -106.32104523100001, 13.2301484511245, 30.766899999999502)
img = plt.imread('/tmp/Miriam.A2012270.2050.2km.jpg')

ax = plt.axes(projection=ccrs.PlateCarree())
plt.title('Hurricane Miriam from the Aqua/MODIS satellite\n'
          '2012 09/26/2012 20:50 UTC')

ax.set_extent([-125, -105, 10, 35], ccrs.Geodetic())

ax.imshow(img, origin='upper', extent=img_extent, transform=ccrs.PlateCarree())
ax.coastlines(resolution='50m', color='black', linewidth=1)
ax.gridlines()

plt.show()
它将生成以下图片 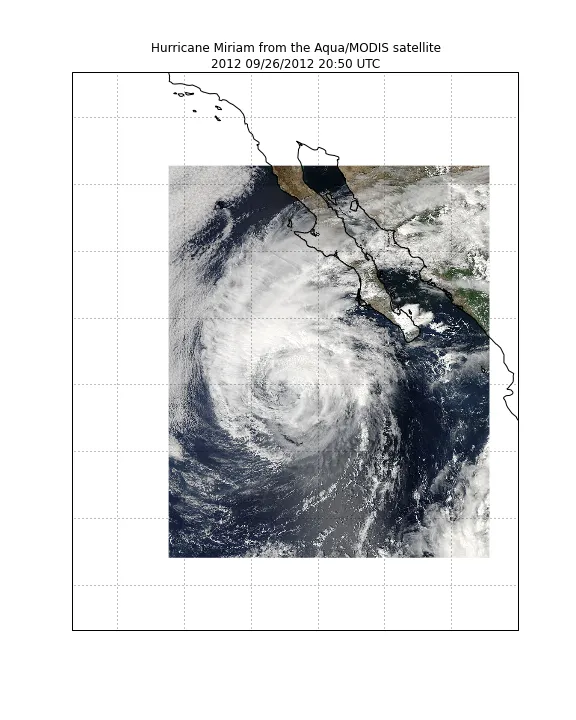
然而,当我尝试选择不同的投影方式(比如Lambert Conformal),用替换方法来改变原有代码
ax = plt.axes(projection=ccrs.PlateCarree())
使用
ax = plt.axes(projection=ccrs.LambertConformal())
我得到了以下图片:
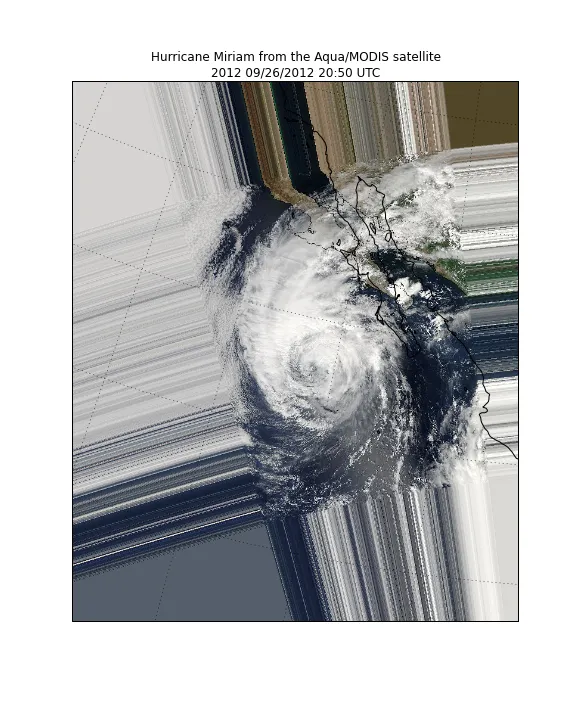
正如你所看到的,这张图片存在问题。我做错了什么?是否可以在不同的投影方式下显示此图片?
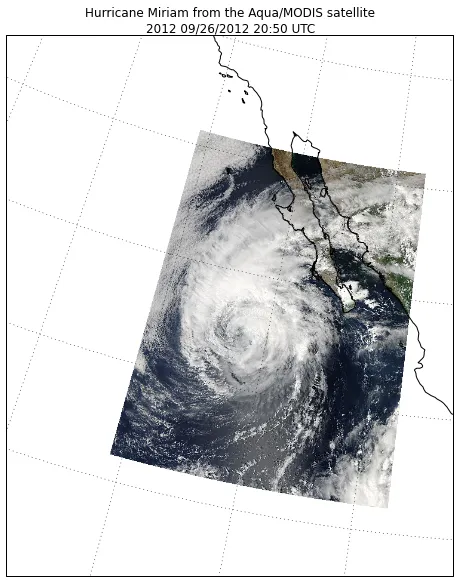
pcolormesh作为替代方案。 - Rutger Kassies