按照以下步骤,您应该能够解决问题:
fig = plt.figure(figsize=(3*wcell+wpad, nrows*hcell+hpad))
两行之间的线是坐标轴脊柱。
ax.xaxis.set_visible(False)
ax.yaxis.set_visible(False)
仅隐藏轴标签和刻度,不要隐藏轴脊线。您必须隐藏它们或将它们涂成白色。
完整解决方案请见下文
无论如何:在我看来,你正在进行许多无用的操作。从你的代码片段中,我觉得clust_data已经是一个具有正确形状的列表,而填充后的cellText将与clust_data相同。
此外,尽量不要混合使用matplotlib的OO和pyplot接口。
以下代码应该与您的代码等效
fig=plt.figure()
ax = fig.add_subplot(111)
ax.xaxis.set_visible(False)
ax.yaxis.set_visible(False)
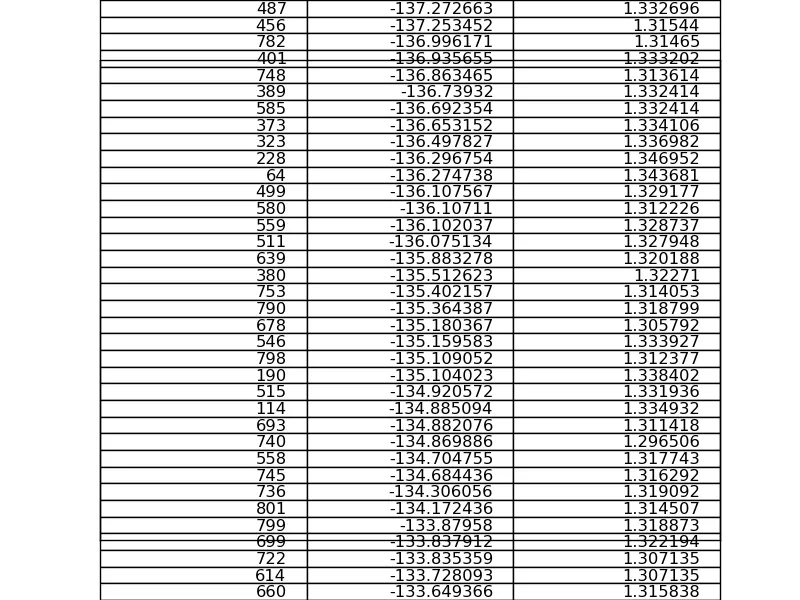
colLabels=("Structure", "Energy", "Density")
the_table = ax.table(cellText=clust_data,
colLabels=colLabels,
loc='center')
plt.savefig("table.png")
完整解决方案:
复杂方式
您需要隐藏坐标轴脊柱(例如将它们的颜色设置为白色)并给它们较低的zorder,然后添加具有更高zorder的表格。
colLabels=("Structure", "Energy", "Density")
nrows, ncols = len(clust_data)+1, len(colLabels)
hcell, wcell = 0.3, 1.
hpad, wpad = 0, 0
fig=plt.figure(figsize=(ncols*wcell+wpad, nrows*hcell+hpad))
ax = fig.add_subplot(111)
ax.xaxis.set_visible(False)
ax.yaxis.set_visible(False)
for sp in ax.spines.itervalues():
sp.set_color('w')
sp.set_zorder(0)
the_table = ax.table(cellText=clust_data,
colLabels=colLabels,
loc='center')
the_table.set_zorder(10)
plt.savefig("table.png")
简单方法(感谢 @JoeKington)
只需关闭轴即可。
colLabels=("Structure", "Energy", "Density")
nrows, ncols = len(clust_data)+1, len(colLabels)
hcell, wcell = 0.3, 1.
hpad, wpad = 0, 0
fig=plt.figure(figsize=(ncols*wcell+wpad, nrows*hcell+hpad))
ax = fig.add_subplot(111)
ax.axis('off')
the_table = ax.table(cellText=clust_data,
colLabels=colLabels,
loc='center')
plt.savefig("table.png")
clust_data)执行双重循环,而外部循环除了创建和保存len(clust_data)之外没有做任何事情:第一个for循环是笔误吗? - Francesco Montesano