这是我之前问题HERE的后续问题。我发现我的Java应用程序存在内存泄漏。最初,我认为泄漏来自于应用程序的服务器组件。但根据其他人的建议,它并不是。我使用了一个工具来转储堆内存,并使用
导致泄漏问题的原因是什么?如何从以下转储中识别它? 显然,我使用 new Object() 和 HashMap.put() 的方式存在一些泄漏问题!
首先是启动类/主类。在这里,我初始化了7个主要的HashMap,每个HashMap将一个键(现在只有一个 - 最终将有16个键)映射到大约4000个单行JSON字符串的时间序列NavigableMap。
在
JProfiler可视化它。显然,这是由于我怀疑的HashMaps引起的。但我不确定,因为我不熟悉如何解释这个转储文件。
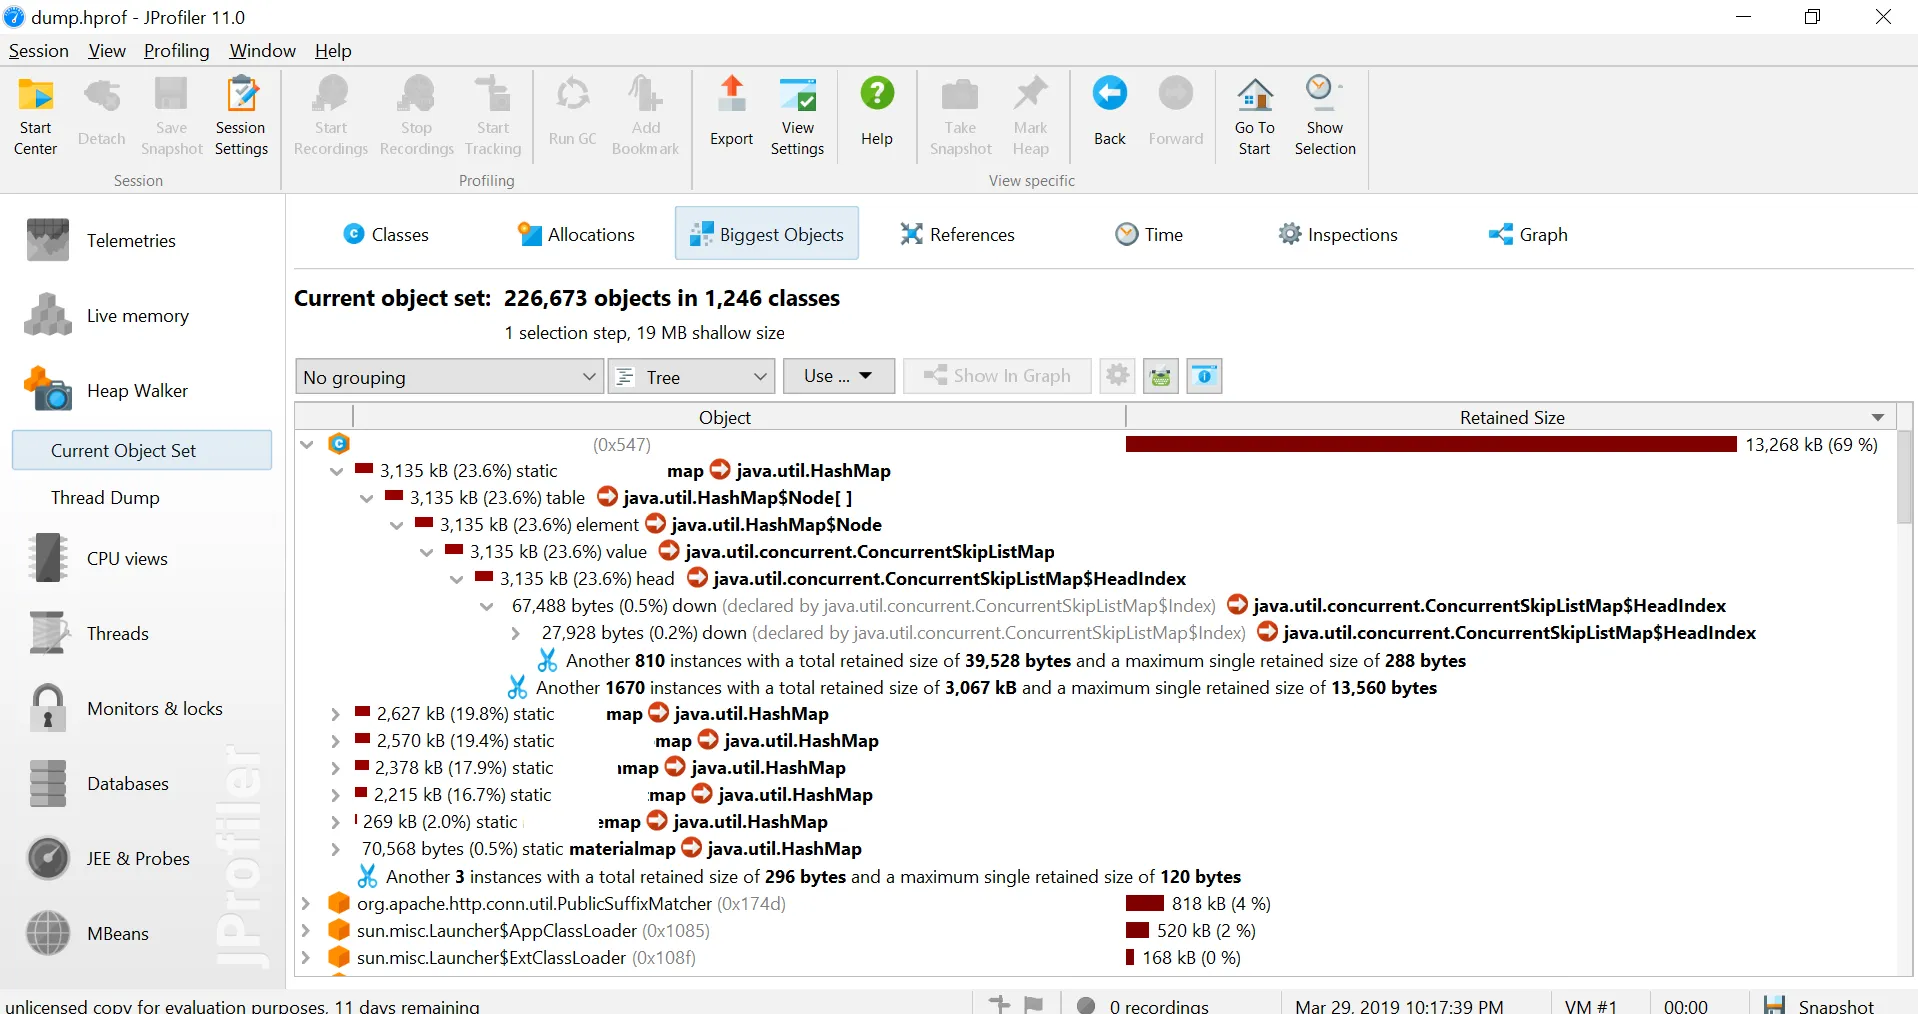
导致泄漏问题的原因是什么?如何从以下转储中识别它? 显然,我使用 new Object() 和 HashMap.put() 的方式存在一些泄漏问题!
首先是启动类/主类。在这里,我初始化了7个主要的HashMap,每个HashMap将一个键(现在只有一个 - 最终将有16个键)映射到大约4000个单行JSON字符串的时间序列NavigableMap。
public class MyCache {
        static HashMap <String, NavigableMap <Long, String>> map1= new HashMap <String, NavigableMap <Long, String>> ();
        static HashMap <String, NavigableMap <Long, String>> map2= new HashMap <String, NavigableMap <Long, String>> ();
        static HashMap <String, NavigableMap <Long, String>> map3= new HashMap <String, NavigableMap <Long, String>> ();
        static HashMap <String, NavigableMap <Long, String>> map4= new HashMap <String, NavigableMap <Long, String>> ();
        static HashMap <String, NavigableMap <Long, String>> map5= new HashMap <String, NavigableMap <Long, String>> ();
        static HashMap <String, NavigableMap <Long, String>> map6= new HashMap <String, NavigableMap <Long, String>> ();
        static HashMap <String, NavigableMap <Long, String>> map7= new HashMap <String, NavigableMap <Long, String>> ();

        public static void main(String[] args) throws Exception {
    new Server();
    new Aggregation();
    }
}
在
Aggregation()中,我从HTTP资源获取一些文本,将它们转换为JSON字符串,并将它们缓存到一些临时的NavigableMaps中,然后将它们放入主要的HashMap中(这样刷新不会对服务器产生太大影响)。public class Aggregation {
static NavigableMap <Long, String> map1Temp= new ConcurrentSkipListMap <Long, String> ();;
static NavigableMap <Long, String> map2Temp = new ConcurrentSkipListMap <Long, String> ();
static NavigableMap <Long, String> map3Temp= new ConcurrentSkipListMap <Long, String> ();
static NavigableMap <Long, String> map4Temp= new ConcurrentSkipListMap <Long, String> ();
static NavigableMap <Long, String> map5Temp = new ConcurrentSkipListMap <Long, String> ();
static NavigableMap <Long, String> map6Temp = new ConcurrentSkipListMap <Long, String> ();
static NavigableMap <Long, String> map7Temp = new ConcurrentSkipListMap <Long, String> ();
public Aggregation(){
// loop to cache last 15 mins
while (true) {
logger.info("START REFRESHING ...");
for (int i = 0; i < mylist.size(); i++) {
long startepoch = getTime(mylist.get(i).time);
MyItem m = mylist.get(i);
String index=(i+1)+"";
process1(index, m.name, startepoch);
//adds to map1Temp
process2(index, m.name, startepoch);
//adds to map2Temp
process3(index, m.name, startepoch);
//adds to map3Temp
process4(index, m.name, startepoch);
//adds to map4Temp
process5(index, m.name, startepoch);
//adds to map5Temp
process6(index, m.name, startepoch);
//adds to map6Temp
process7(index, m.name, startepoch);
//adds to map7Temp
}
//then `put` them in the main `HashMap` all at-once:
MyCache.map1.put(channel, new ConcurrentSkipListMap <Long, String> (map1Temp));
MyCache.map2.put(channel, new ConcurrentSkipListMap <Long, String> (map2Temp));
MyCache.map3.put(channel, new ConcurrentSkipListMap <Long, String>(map3Temp));
MyCache.map4.put(channel, new ConcurrentSkipListMap <Long, String>(map4Temp));
MyCache.map5.put(channel, new ConcurrentSkipListMap <Long, String> (map5Temp));
MyCache.map6.put(channel, new ConcurrentSkipListMap <Long, String> (map6Temp));
MyCache.map7.put(channel, new ConcurrentSkipListMap <Long, String> (map7Temp));
//printing the size of all Hashmap entries. They don't grow :-/
logger.info("\t"+"map1.size(): "+MyCache.map1.get(key).size());
logger.info("\t"+"map2.size(): "+MyCache.map2.get(key).size());
//and other 5...
//then clear the temp maps so they don't grow over and over
map1Temp.clear();
map2Temp.clear();
map3Temp.clear();
map4Temp.clear();
map5Temp.clear();
map6Temp.clear();
map7Temp.clear();
}
//sleep for 15 min until next caching cycle
Thread.sleep(cacheEvery*1000*60);
}
Hashmaps不应该增长。你能看一下吗? - Tina JtempMap<n>实例的副本,但清除原始实例。然后将这些副本放入MyCache映射中。如果channel引用更改或其指向的值是可变的,则可能会在MyCache映射中积累多个ConcurrentSkipListMap实例。事实上,这就是分析器似乎在说发生的事情。相信证据! - Stephen C