import pandas as pd
mydf = pd.DataFrame({
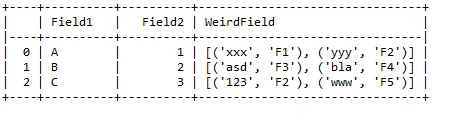
'Field1' : ['A','B','C'],
'Field2' : ['1','2','3'],
'WeirdField' :[
[ ('xxx', 'F1'), ('yyy','F2'),('xyz','F6') ],
[ ('asd', 'F3'), ('bla','F4') ],
[ ('123', 'F2'), ('www','F5') ,('mno','F1') ]
]
})
print mydf.head()
newdf = pd.DataFrame({'Field1' : ['A','B','C'],
'Field2' : ['1','2','3'],
})
column_names = []
for index, row in mydf.iterrows():
for j in range( len(mydf['WeirdField'][index])):
column_names.append( mydf['WeirdField'][index][j][1])
new_column_names = list(set(column_names))
for i,j in enumerate(new_column_names):
newdf.insert(i+2,j,None)
for index, row in mydf.iterrows():
for j in range( len(mydf['WeirdField'][index])):
newdf.set_value(index, [mydf['WeirdField'][index][j][1]], mydf['WeirdField'][index][j][0])
print newdf.head()
产生
  Field1 Field2    F1    F2    F3    F4    F5    F6
0      A      1   xxx   yyy  None  None  None   xyz
1      B      2  None  None   asd   bla  None  None
2      C      3   mno   123  None  None   www  None