在一起显示2个tmap对象

5

例子:

我想将由此代码生成的两个tmap图并排放置。

library(tmap)
library(gridExtra)

data(World)

plot1=
  tm_shape(World, projection = "merc") + 
  tm_layout("", inner.margins=c(-1.72, -2.05, -0.75, -1.56)) +
  tm_borders(alpha = 0.3, lwd=2)

plot2=
  tm_shape(World, projection = "merc") + 
  tm_layout("", inner.margins=c(-1.72, -2.05, -0.75, -1.56)) +
  tm_borders(alpha = 0.3, lwd=2)

plot1plot2作为单独的图表可以正常工作: enter image description here

问题:

我无法将两个图表并排放置。我尝试了:

grid.arrange(plot1, plot2)报错:Error in arrangeGrob(..., as.table = as.table, clip = clip, main = main, : input must be grob!。我认为这应该可以使用gridExtra来解决,因为tmap似乎是基于grid graphics system构建的。

此外,par(mfrow=c(1,2))也不起作用,因为它只显示一个图表(我猜测这与tmap绘图不遵循base graphics system有关)。

问题:

如何将plot1plot2对象并排显示(ncol=2)?

更新:

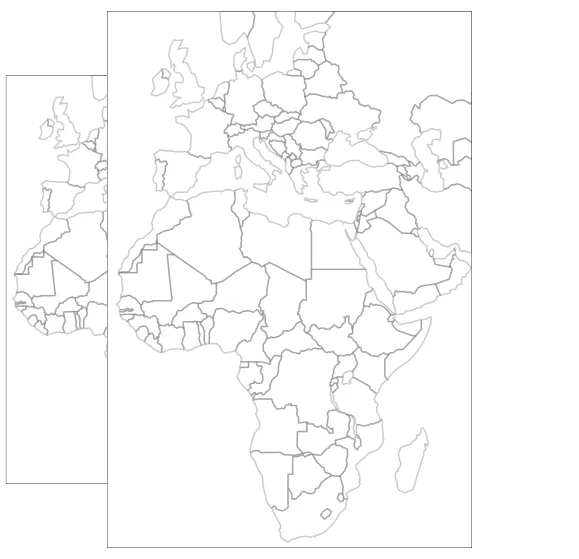
关于提出的基于网格的解决方案,我得到的是重叠的图表,而不是两列排列的图表。

enter image description here

> sessionInfo()
R version 3.1.2 (2014-10-31)
Platform: x86_64-apple-darwin13.4.0 (64-bit)

locale:
[1] de_DE.UTF-8/de_DE.UTF-8/de_DE.UTF-8/C/de_DE.UTF-8/de_DE.UTF-8

attached base packages:
[1] stats     graphics  grDevices utils     datasets  methods   base     

other attached packages:
[1] tmap_1.0    dplyr_0.4.3 sp_1.1-1   

loaded via a namespace (and not attached):
 [1] assertthat_0.1     class_7.3-11       classInt_0.1-23    colorspace_1.2-6   DBI_0.3.1          digest_0.6.8       e1071_1.6-4        ggplot2_1.0.1     
 [9] grid_3.1.2         gridBase_0.4-7     gtable_0.1.2       lattice_0.20-29    magrittr_1.5       MASS_7.3-35        munsell_0.4.2      parallel_3.1.2    
[17] plyr_1.8.3         proto_0.3-10       R6_2.1.1           raster_2.3-40      RColorBrewer_1.1-2 Rcpp_0.12.2        reshape2_1.4.1     rgdal_0.8-16      
[25] rgeos_0.3-11       scales_0.3.0       stringi_1.0-1      stringr_1.0.0      tools_3.1.2 
3个回答

12

tmap_arrange()

https://cran.r-project.org/web/packages/tmap/tmap.pdf

data(World)
w1 <- qtm(World, projection = "eck4", title="Eckert IV")
w2 <- qtm(World, projection = "merc", title="Mercator")
w3 <- qtm(World, projection = "wintri", title="Winkel-Tripel")
w4 <- qtm(World, projection = "robin", title="Robinsin")

current.mode <- tmap_mode("plot")
tmap_arrange(w1, w2, w3, w4)
tmap_mode(current.mode)

7

好问题!

grid.arrange目前还不支持tmap图形,就像支持ggplot2图形一样。

有两个选项:

1)通过将两个值分配给美学来使用小多面板(请参见tm_facets的示例)。虽然您的图形不使用美学,但可以按照以下方式进行操作:

tm_shape(World, projection = "merc") + 
  tm_fill(col=c("white", "white")) +
  tm_layout("", inner.margins=c(-1.72, -2.05, -0.75, -1.56)) +
  tm_borders(alpha = 0.3, lwd=2)

2) 使用 grid 包定义视口:

library(grid)
grid.newpage()
pushViewport(viewport(layout=grid.layout(1,2)))
print(plot1, vp=viewport(layout.pos.col = 1))
print(plot2, vp=viewport(layout.pos.col = 2))

另外,与其使用负内边距来裁剪形状,您也可以在 tm_shape 中使用边界框参数:

tm_shape(World, projection = "merc", xlim=c(-2e6, 6.5e6), ylim=c(-4e6, 8.5e6)) + 
  tm_borders(alpha = 0.3, lwd=2)

它生成相同的地图,但代码更清晰。

非常感谢,不幸的是仍然有两个问题:a)基于网格的解决方案绘制了两个图,但它们重叠在一起。b)使用多个创建的解决方案将两个图形对齐得很好,但在1列而不是2列中。 - user2030503
1
你能发布一下问题a的图片吗?至于问题b,行数和列数是由图形设备和形状的纵横比自动确定的。你可以使用+tm_facets(ncol=2)手动设置它们。 - Martijn Tennekes
它对我来说是有效的。你能分享下你的sessionInfo()吗? - Martijn Tennekes
啊,正如我所想!tmap 1.2已经在CRAN上发布了两周,其中视口错误已经得到修复。 - Martijn Tennekes
非常感谢,不幸的是 CRAN 上的 OS X Mavericks 二进制文件仍然是 v1.0 版本。 - user2030503

0

我想知道在此期间是否已经有可能将以下示例中的5个地图并排绘制,而无需切换到tm_facets(ncol=5)

data(NLD_prov, NLD_muni)

tmap_mode("plot")
tm_shape(NLD_muni) +
tm_fill(c("pop_0_14", "pop_15_24", "pop_25_44", "pop_45_64", "pop_65plus"),
        style="kmeans", 
        palette=list("Oranges", "Greens", "Blues", "Purples", "Greys"),
        title=c("Population 0 to 14", "Population 15 to 24", "Population 25 to 44",
                "Population 45 to 64", "Population 65 and older")) +
tm_shape(NLD_prov) +
tm_borders() +
tm_format_NLD(frame = TRUE, asp=0)

网页内容由stack overflow 提供, 点击上面的
可以查看英文原文,
原文链接