如果我添加一个使用3行的xticlabel,gnuplot会在第二行中间切断。有没有办法使xticlabels具有多行呢?
这是我的数据文件:
"[17h30,19h00] 25" 1
"[03h30,10h00] 21" 1
"[03h00,12h00] 26" 2
"[18h00,19h30] 27" 3
"[20h30,22h00] 25" 4
"[13h00,14h30] 25" 4
"[19h30,21h30] 25" 5
"[14h30,16h00] 25" 5
"[16h30,18h00] 25" 5
"[09h30,15h00] 25" 9
以下是我的gnuplot代码:
set terminal postscript eps color
set output '| epstopdf --filter --outfile=hist.pdf'
set auto x
set yrange [0:10]
set style histogram clustered
set boxwidth 0.95 relative
set style fill transparent solid 0.5 noborder
plot 'hist.dat' using 2:xticlabels(1) with boxes lc rgb'blue90' notitle
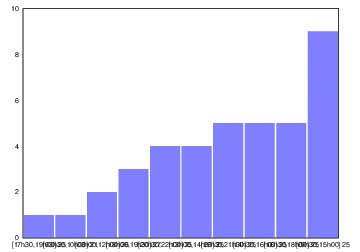
最终生成的图表如下所示:
set terminal pdf或set terminal pdfcairo,然后发出set output 'myoutput.pdf',而不是像您目前所做的那样设置 eps 终端。 - andyras