如何在matplotlib中打印摄氏度符号?

14

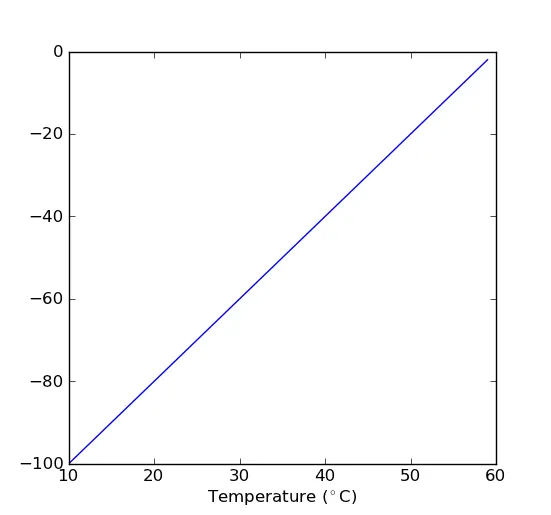
我想打印一个坐标轴标签:“温度(℃)”。我该如何做?代码示例:

# -*- coding: utf-8 -*-
import matplotlib.pyplot as plt
x = range(10,60,1)
y = range(-100, 0, 2)
fig = plt.figure()
ax = fig.add_subplot(111)
ax.plot(x,y)
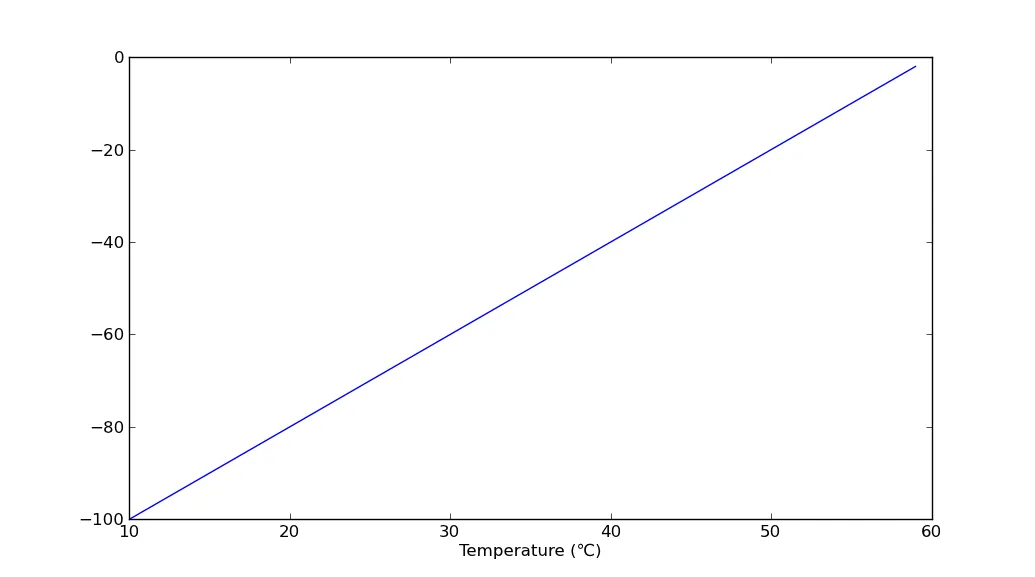
ax.set_xlabel('Temperature (℃)')

对于最后一行,我已经尝试过:

ax.set_xlabel('Temperature (℃)'.encode('utf-8'))

ax.set_xlabel(u'Temperature (u\2103)')

ax.set_xlabel(u'Temperature (℃)')

ax.set_xlabel(u'Temperature (\u2103)')

ax.set_xlabel('Temperature (\u2103)')

我就是不明白。我正在使用Spyder并从那里运行代码。


1
如果在Spyder之外的脚本中运行,您的代码是否有效? - unutbu
啊,我最初确实尝试过那个,但是得到的结果和从Spyder中运行它一样(无论如何都可能是错误的表述)。我应该再试试我上面列出的几个。 - a different ben
6个回答

30

使用LaTeX解释器来制作度数符号。

ax.set_xlabel('Temperature ($^\circ$C)')

以下是结果:

enter image description here


3
我认为这对我来说是最好的解决方案。它的优点还在于使我的图表标签与文本相匹配(我使用LaTeX排版)。我用\textcelsius代替了$^\circ$C。 - a different ben

8
ax.set_xlabel(u'Temperature (℃)')

应该可以正常工作:

图片描述

In [56]: matplotlib.__version__
Out[56]: '1.0.1'

似乎Spyder不支持UTF-8。我甚至无法使用“Ctrl+Shift+U”组合键方法输入UTF-8字符。Spyder的编辑器会忽略它并输入一个“U”。我正在从GNOME的字符映射应用程序中复制摄氏符号。 - a different ben

8
为了在没有LaTex解释器的情况下在matplotlib中实现这一点,请使用unicode格式化 Unicode字符串。
from numpy import arange, cos, pi
from matplotlib.pyplot import (figure, axes, plot, xlabel, ylabel, title,
                               grid, show)
figure(1, figsize=(6,4))
ax = axes([0.1, 0.1, 0.8, 0.7])
t = arange(0.0, 1.0 + 0.01, 0.01)
s = 3*cos(2*pi*t)+25
plot(t, s)

title('Average High Temperature')
xlabel('Year')
ylabel(u'Temp (\u00B0C)')
grid(True)
show()

enter image description here


在我看来,这个看起来最好;LaTeX中的$\circ$圆太小了。 - Luke Davis

7

使用度符号U+00B0(°)紧跟大写字母,而不是使用摄氏度U+2103(℃)。这种方式更安全,原因包括字体覆盖范围等。这也是Unicode标准(15.2 Letterlike symbols; p. 481)推荐的方式。


1

或者:

ax.set_xlabel(u'Temperature (\N{DEGREE SIGN}C)')

如果你想使它同时适用于TeX和非TeX,那么可能需要使用两种方法,并在之前使用if rcParams['text.usetex'] 进行测试。例如,这就是basemap中的做法

0

Spyder用户的更新:

$^\circ$ - 可以使用!

\N{DEGREE SIGN} - 给我小写的γ符号...


网页内容由stack overflow 提供, 点击上面的
可以查看英文原文,
原文链接