我有一个StackedXYAreaChart,看起来像这样:
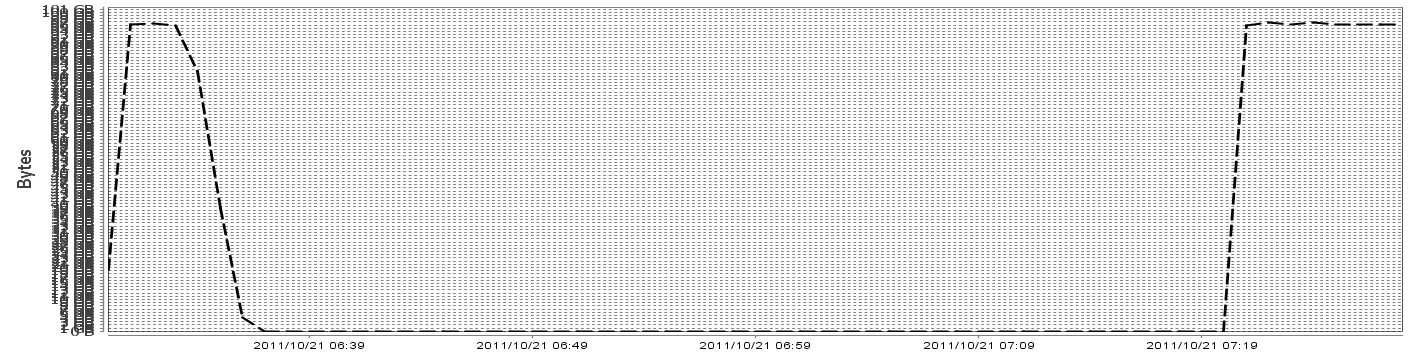
如何格式化Y轴单位,使它们间距均匀并在特定间隔内显示? 例如,不要按1的增量(例如0, 1, 2, 3, ... 100)显示单位,而是按10或25的增量显示单位(例如0, 25, 50, 75, 100)。 谢谢!
我有一个StackedXYAreaChart,看起来像这样:
如何格式化Y轴单位,使它们间距均匀并在特定间隔内显示? 例如,不要按1的增量(例如0, 1, 2, 3, ... 100)显示单位,而是按10或25的增量显示单位(例如0, 25, 50, 75, 100)。 谢谢!
CustomTickUnit,它可以格式化数字并在后缀中添加单位,例如1000000变成了1 GB。public void setupRangeAxis(NumberAxis rangeAxis) {
final TickUnits standardUnits = new TickUnits();
standardUnits.add(new CustomTickUnit(1));
standardUnits.add(new CustomTickUnit(10));
standardUnits.add(new CustomTickUnit(100));
standardUnits.add(new CustomTickUnit(1000)); // Kilo
standardUnits.add(new CustomTickUnit(10000));
standardUnits.add(new CustomTickUnit(100000));
standardUnits.add(new CustomTickUnit(1000000)); // Mega
standardUnits.add(new CustomTickUnit(10000000));
standardUnits.add(new CustomTickUnit(100000000));
standardUnits.add(new CustomTickUnit(1000000000)); // Giga
standardUnits.add(new CustomTickUnit(10000000000L));
standardUnits.add(new CustomTickUnit(100000000000L));
standardUnits.add(new CustomTickUnit(1000000000000L)); // Tera
standardUnits.add(new CustomTickUnit(10000000000000L));
standardUnits.add(new CustomTickUnit(100000000000000L));
standardUnits.add(new CustomTickUnit(1000000000000000L)); // Peta
standardUnits.add(new CustomTickUnit(10000000000000000L));
standardUnits.add(new CustomTickUnit(100000000000000000L));
standardUnits.add(new CustomTickUnit(1000000000000000000L)); // Exa
rangeAxis.setStandardTickUnits(standardUnits);
}
CategoryPlot plot = chart.getCategoryPlot();

NumberAxis rangeAxis = (NumberAxis) plot.getRangeAxis();

rangeAxis.setTickUnit(new NumberTickUnit(300));