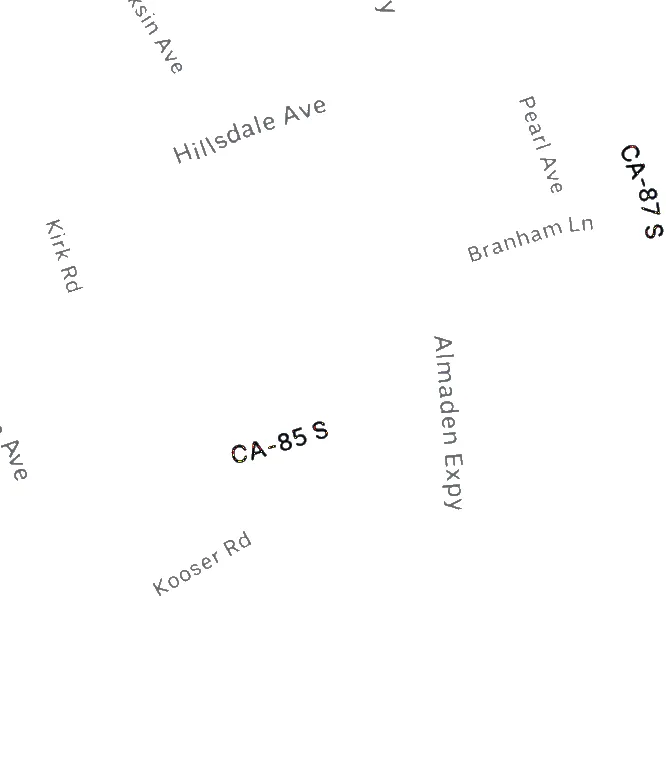
例如,在下面的应用截图中,我想要紧密地围绕CA-85S(水平蓝线上的文本)和Almaden Expy(与蓝线重叠的文本)获取边界框。我正在提取这些边界框用于OCR。
我已经尝试了几种openCV方法,但都不适用于我。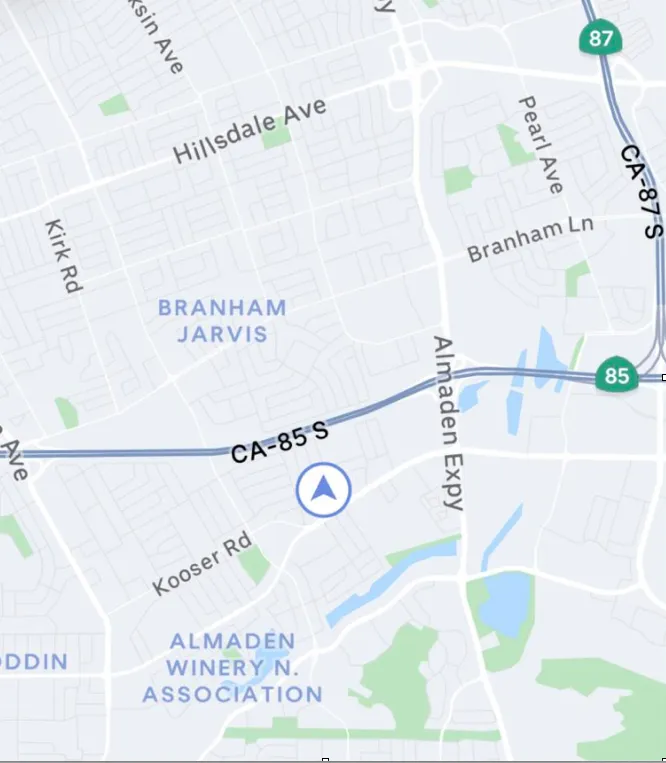
我已经尝试了几种openCV方法,但都不适用于我。
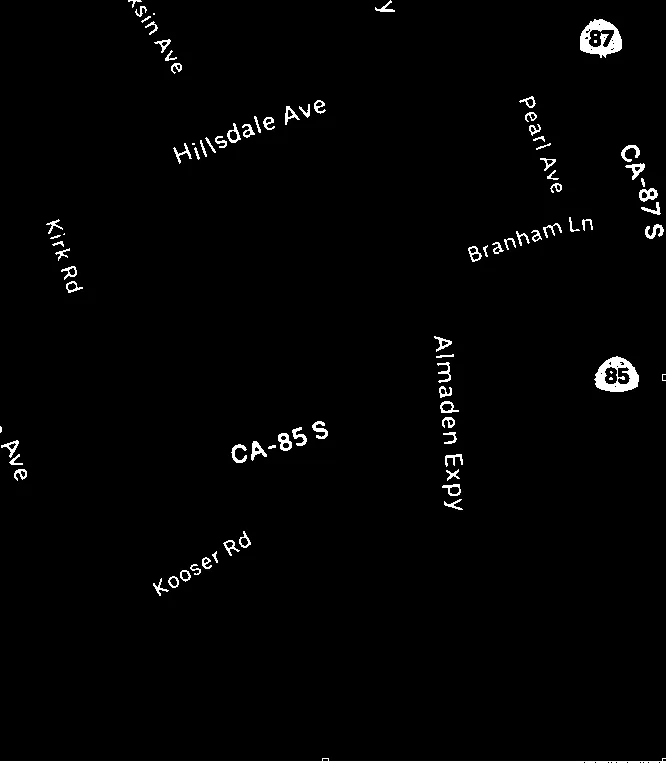
通过观察,我们发现所需提取的文本是黑色的,与蓝色河流背景线形成对比。一种潜在的方法是使用颜色阈值化和cv2.inRange。以下是主要思路和Python实现:
获取颜色分割掩模。 加载图像,将其转换为HSV格式,定义下限和上限颜色范围,然后进行颜色分割以获得掩模。
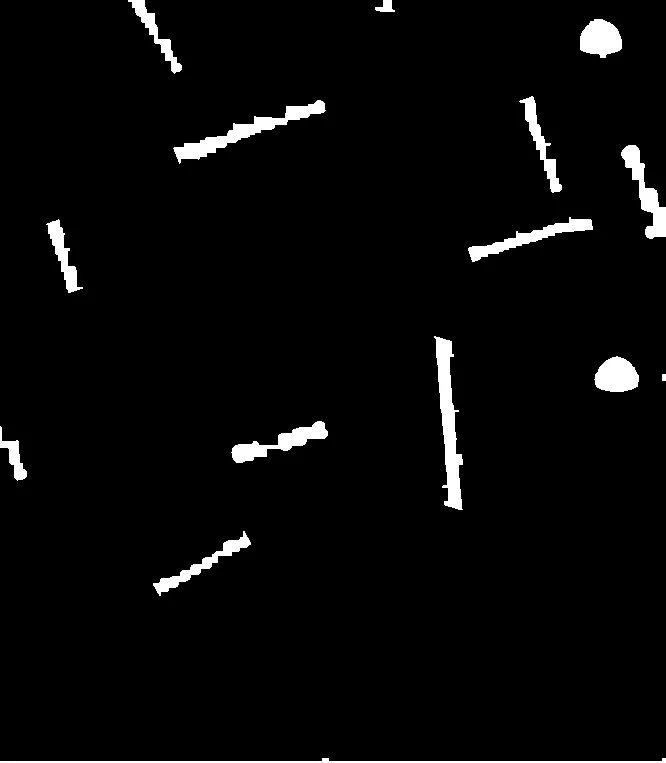
将文本合并为单个轮廓。 我们使用 cv2.getStructuringElement 创建一个矩形结构元素,然后使用形态学操作将单个文本字母合并为单个轮廓。
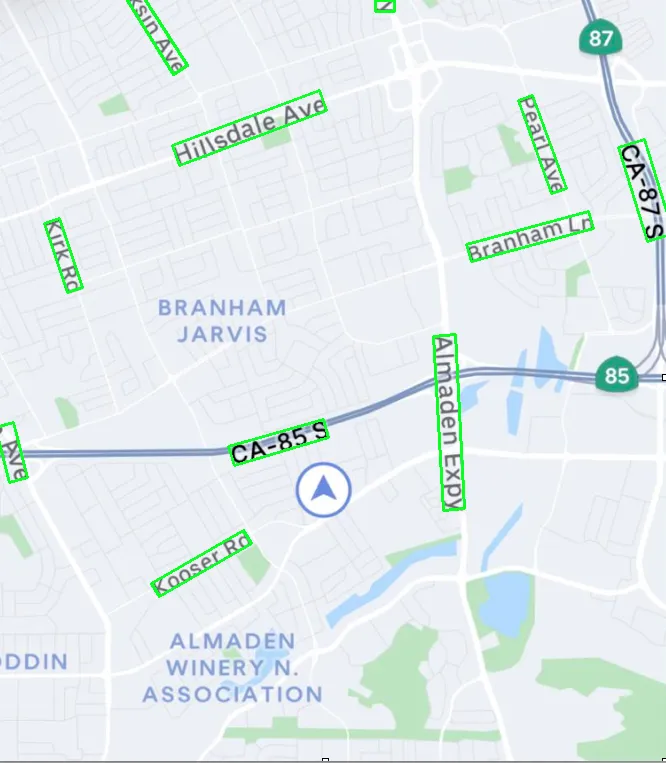
筛选文本轮廓。 我们使用 cv2.findContours 查找轮廓,遍历轮廓,然后使用cv2.contourArea和纵横比进行筛选。 如果轮廓通过此筛选器,则我们找到旋转的边界框。
隔离文本。 我们可以执行此可选步骤,仅使用cv2.bitwise_and提取文本。
将文本变形以连接成单个轮廓
结果
提取个别文本
代码
import cv2
import numpy as np

# Load image, convert to HSV, color threshold to get mask
image = cv2.imread('1.png')
original = image.copy()
blank = np.zeros(image.shape[:2], dtype=np.uint8)
hsv = cv2.cvtColor(image, cv2.COLOR_BGR2HSV)
lower = np.array([0, 0, 0])
upper = np.array([179, 255, 165])
mask = cv2.inRange(hsv, lower, upper)

# Merge text into a single contour
kernel = cv2.getStructuringElement(cv2.MORPH_RECT, (5,5))
close = cv2.morphologyEx(mask, cv2.MORPH_CLOSE, kernel, iterations=3)

# Find contours
cnts = cv2.findContours(close, cv2.RETR_EXTERNAL, cv2.CHAIN_APPROX_SIMPLE)
cnts = cnts[0] if len(cnts) == 2 else cnts[1]
for c in cnts:
    # Filter using contour area and aspect ratio
    x,y,w,h = cv2.boundingRect(c)
    area = cv2.contourArea(c)
    ar = w / float(h)
    if (ar > 1.4 and ar < 4) or ar < .85 and area > 100:
        # Find rotated bounding box
        rect = cv2.minAreaRect(c)
        box = cv2.boxPoints(rect)
        box = np.int0(box)
        cv2.drawContours(image,[box],0,(36,255,12),2)
        cv2.drawContours(blank,[box],0,(255,255,255),-1)

# Bitwise operations to isolate text
extract = cv2.bitwise_and(mask, blank)
extract = cv2.bitwise_and(original, original, mask=extract)
extract[extract==0] = 255

cv2.imshow('mask', mask)
cv2.imshow('image', image)
cv2.imshow('close', close)
cv2.imshow('extract', extract)
cv2.waitKey()
import cv2
import numpy as np

def nothing(x):
    pass

# Load image
image = cv2.imread('1.png')

# Create a window
cv2.namedWindow('image')

# Create trackbars for color change
# Hue is from 0-179 for Opencv
cv2.createTrackbar('HMin', 'image', 0, 179, nothing)
cv2.createTrackbar('SMin', 'image', 0, 255, nothing)
cv2.createTrackbar('VMin', 'image', 0, 255, nothing)
cv2.createTrackbar('HMax', 'image', 0, 179, nothing)
cv2.createTrackbar('SMax', 'image', 0, 255, nothing)
cv2.createTrackbar('VMax', 'image', 0, 255, nothing)

# Set default value for Max HSV trackbars
cv2.setTrackbarPos('HMax', 'image', 179)
cv2.setTrackbarPos('SMax', 'image', 255)
cv2.setTrackbarPos('VMax', 'image', 255)

# Initialize HSV min/max values
hMin = sMin = vMin = hMax = sMax = vMax = 0
phMin = psMin = pvMin = phMax = psMax = pvMax = 0

while(1):
    # Get current positions of all trackbars
    hMin = cv2.getTrackbarPos('HMin', 'image')
    sMin = cv2.getTrackbarPos('SMin', 'image')
    vMin = cv2.getTrackbarPos('VMin', 'image')
    hMax = cv2.getTrackbarPos('HMax', 'image')
    sMax = cv2.getTrackbarPos('SMax', 'image')
    vMax = cv2.getTrackbarPos('VMax', 'image')

    # Set minimum and maximum HSV values to display
    lower = np.array([hMin, sMin, vMin])
    upper = np.array([hMax, sMax, vMax])

    # Convert to HSV format and color threshold
    hsv = cv2.cvtColor(image, cv2.COLOR_BGR2HSV)
    mask = cv2.inRange(hsv, lower, upper)
    result = cv2.bitwise_and(image, image, mask=mask)

    # Print if there is a change in HSV value
    if((phMin != hMin) | (psMin != sMin) | (pvMin != vMin) | (phMax != hMax) | (psMax != sMax) | (pvMax != vMax) ):
        print("(hMin = %d , sMin = %d, vMin = %d), (hMax = %d , sMax = %d, vMax = %d)" % (hMin , sMin , vMin, hMax, sMax , vMax))
        phMin = hMin
        psMin = sMin
        pvMin = vMin
        phMax = hMax
        psMax = sMax
        pvMax = vMax

    # Display result image
    cv2.imshow('image', result)
    if cv2.waitKey(10) & 0xFF == ord('q'):
        break

cv2.destroyAllWindows()