使用ggplot2,我想绘制一个多边形(凸包?),以尊重栅格图的单元格边界(使用
我可以使用ggplot2的
geom_raster创建)。可以使用凸包方法,但它们会通过x-y坐标而不是绕过栅格图的单元格(对不起,我的术语受到了无知的影响)。例如,给定以下具有分类属性d的x-y坐标数据:df <- data.frame(x = c(295, 300, 305, 310, 295, 300, 305, 310),
y = c(310, 310, 310, 310, 315, 315, 315, 315),
d = c(2, 2, 2, 1, 2, 1, 1, 1))
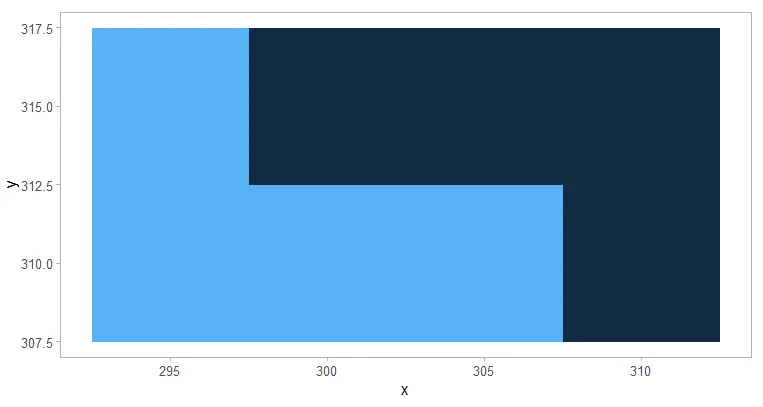
我可以使用ggplot2的
geom_raster函数将属性作为填充来绘制:ggplot(df, aes(x, y)) +
geom_raster(aes(fill = d)) +
coord_fixed()
需要提供:
但我想要的是由d定义的类别的轮廓线。大致如下所示:
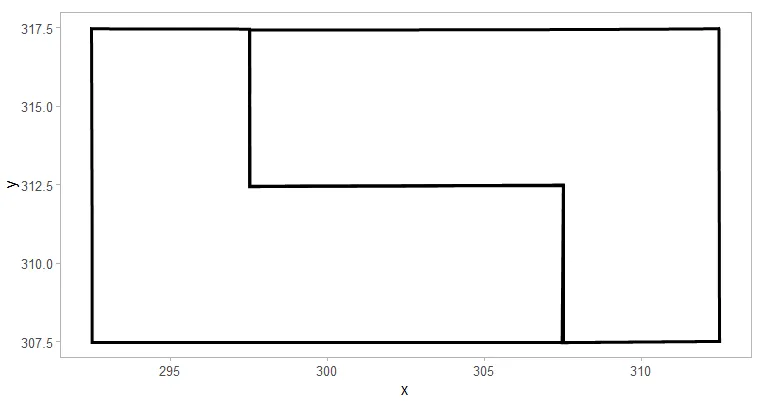
我是否可以使用基本的R和ggplot2来实现这一点,或者使用raster包或其他网格/栅格/GIS包来完成?我希望尽可能简单。
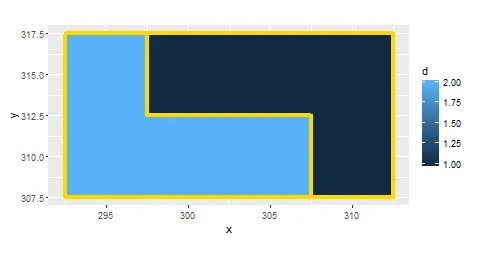
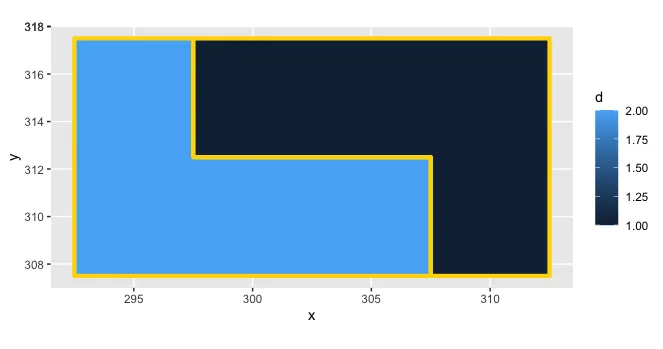
obj <- fortify(pp),然后将其附加到你的示例中的ggplot()调用中:geom_path(aes(x = long, y = lat, group = group), data = obj)。它可以工作,尽管我猜这不是 ggplot2 用户通常的做法... - Josh O'Brienoutline <- df %>% rasterFromXYZ() %>% rasterToPolygons(dissolve = TRUE) %>% fortify(region = "d")- Alex Trueman