在网格的方框中计算点数

4

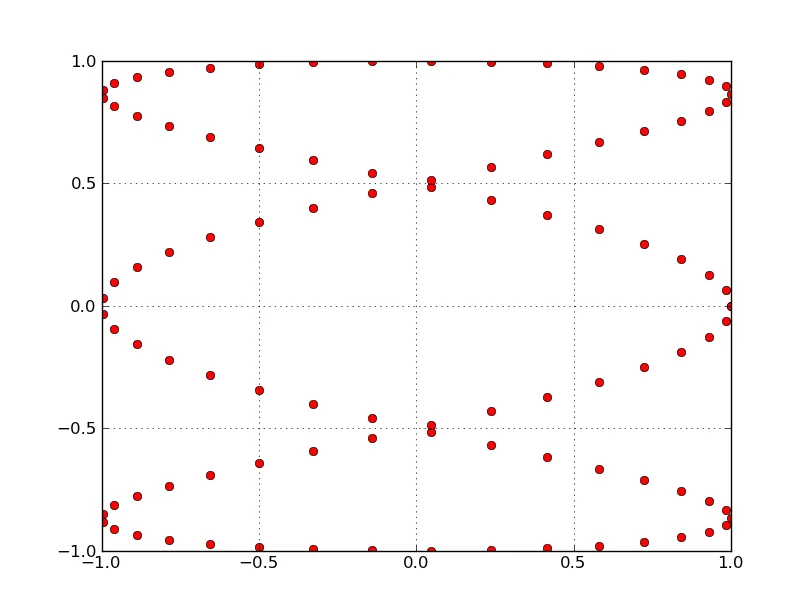
假设有一个类似下图中的网格,其中有一些点。 Demo 我的目标是计算每个网格单元格中的点数。以下是我的第一次尝试。

            for tupel in point_list:
               a=0
               b=0
               for i in self.boxvector:
                  if tupel[0] < i:
                     a=self.boxvector.index(i)-1
                     break

               for i in self.boxvector:
                  if tupel[1] < i:
                     b=self.boxvector.index(i)-1
                     break

               farray[a][b]+=1

它能运行,但速度很慢。有什么方法可以稍微加快它的速度吗?

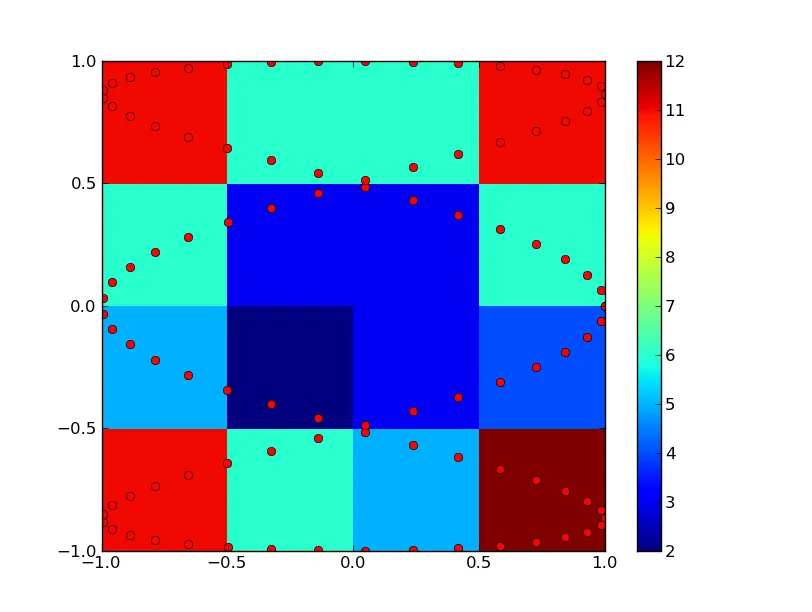
我使用一个名为boxvector的变量来定义网格。在这个例子中,boxvector是:boxvector = [-1., -.5, 0, .5, 1.]。网格始终是二次的,最大值为-1和1。 盒子通过farray表示,它看起来像farray = [[0,0,0,0],[0,0,0,0],[0,0,0,0],[0,0,0,0]]。因此,每个盒子都有一个值,每当算法在相应的盒子中找到一个点时,该值就会增加。point_list的形式为point_list = [(x0,y0),(x1,y1),(x3,y3), ...]

感谢您的帮助!

3个回答

7

看起来您已经在使用matplotlib了,直接使用numpy.histogram2d即可。

例如:

import numpy as np
import matplotlib.pyplot as plt

t = np.linspace(0, 4*np.pi, 100)
x = np.cos(3 * t)
y = np.sin(t)

gridx = np.linspace(-1, 1, 5)
gridy = np.linspace(-1, 1, 5)

grid, _, _ = np.histogram2d(x, y, bins=[gridx, gridy])

plt.figure()
plt.plot(x, y, 'ro')
plt.grid(True)

plt.figure()
plt.pcolormesh(gridx, gridy, grid)
plt.plot(x, y, 'ro')
plt.colorbar()

plt.show()

enter image description here

enter image description here


使用 np.arange 而不是 np.linspace 来获取规则网格。 - Vicky Liau

2

1

您可以计算位置。将其除以0.5(盒子大小)。由于您的数组从0开始,但是您的坐标从-1开始,请在除法之前加1进行调整。您将有一个边缘情况为1((1 + 1)/ 0.5 == 4),因此请确保它不会溢出3。

以下是一个示例:

>>> x,y = (0.8, -0.5)
>>> int((x + 1) / 0.5)
3
>>> int((y + 1) / 0.5)
1

只需考虑获取3的最大结果即可。因此:

>>> f_pos = lambda pos: min(int((pos + 1) / 0.5), 3)
>>> f_pos(x)
3
>>> f_pos(y)
1

所以,把它完成:

f_pos = lambda pos: min(int((pos + 1) / 0.5), 3)
for x,y in point_list:
    f_array[f_pos(x)][f_pos(y)] += 1

网页内容由stack overflow 提供, 点击上面的
可以查看英文原文,
原文链接