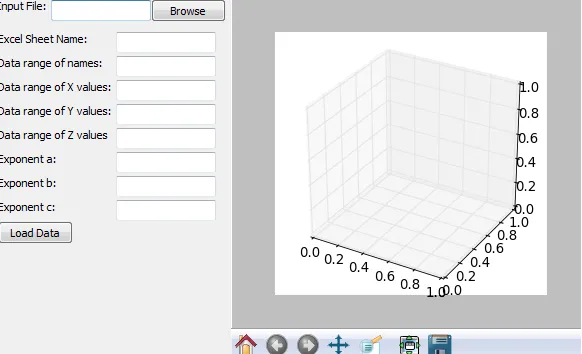
我有一个可能非常简单的问题,需要使用Matplotlib重新绘制一些3D数据。最初,我在画布上有一个带有3D投影的图形:
self.fig = plt.figure()
self.canvas = FigCanvas(self.mainPanel, -1, self.fig)
self.axes = self.fig.add_subplot(111, projection='3d')
我添加了一些数据并使用canvas.draw()进行更新。绘图本身按预期更新,但在图形的外部出现了额外的2D轴(-0.05到0.05),我无法弄清楚如何停止它:
self.axes.clear()
self.axes = self.fig.add_subplot(111, projection='3d')

xs = np.random.random_sample(100)
ys = np.random.random_sample(100)
zs = np.random.random_sample(100)

self.axes.scatter(xs, ys, zs, c='r', marker='o')
self.canvas.draw()
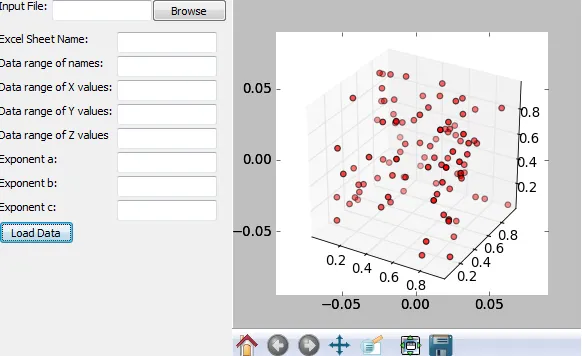
有什么想法吗?我现在陷入了困境!