如何沿着一条路径创建车辆从A到B移动的动画?

8
下面是使用R中的
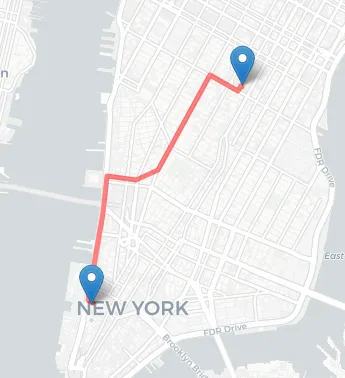
osrm包从“纽约市一世贸中心”到“麦迪逊广场公园”查找路线、旅行时间和旅行距离的示例(我从在R中进行道路路径规划中学到了这个)。旅行时间为10.37分钟。
我想创建一个可视化视频。
问:如何创建一个动画,表示车辆(由标记表示)沿着路线从“纽约市一世贸中心”到“麦迪逊广场公园”移动?
理想情况下,我们应该知道每个路段的速度。但假设车辆在两个位置之间以恒定速度(=距离/时间)连续行驶。
我们可以简单地使用tmap而不是leaflet来创建动画。

enter image description here

library(sf)
library(dplyr)
library(tidygeocoder)
library(osrm)

# 1. One World Trade Center, NYC
# 2. Madison Square Park, NYC
adresses <- c("285 Fulton St, New York, NY 10007", 
            "11 Madison Ave, New York, NY 10010")

# geocode the two addresses & transform to {sf} data structure
data <- tidygeocoder::geo(adresses, method = "osm") %>% 
  st_as_sf(coords = c("long", "lat"), crs = 4326)

osroute <- osrm::osrmRoute(loc = data,
                           returnclass = "sf")

summary(osroute)


library(leaflet)

leaflet(data = data) %>% 
  addProviderTiles("CartoDB.Positron") %>% 
  addMarkers(label = ~address) %>% 
  addPolylines(data = osroute,
               label = "OSRM engine",
               color = "red")

3个回答

11
作为对@mrhellman提出的方法的替代方案,我提供了一种基于、(用于底图)和基于的工作流的替代方案。通过{gganimate}创建动画的结果更好,因为{gganimate}给了我更多的控制权-例如我的观点中很好地说明了汽车沿着线移动的影子_wake。如果我记得正确,tmap在内部使用gganimate。 不支持CartoDB底图-如上面使用的Positron-但我发现toner背景足够。
请注意,与不完全兼容,我发现将我的工作流程转换为旧的方法更容易-即提取x和y坐标并通过aes()进行映射。
由于只有一个路线需要显示,因此计算用于在中使用的技术变量应该足够进行动画处理;这可以被时间维度所替代,当需要在单个动画中显示不同行程时间的多条路线时(例如)。
library(sf)
library(dplyr)
library(tidygeocoder)
library(osrm)

# 1. One World Trade Center, NYC
# 2. Madison Square Park, NYC
adresses <- c("285 Fulton St, New York, NY 10007", 
              "11 Madison Ave, New York, NY 10010")

# geocode the two addresses & transform to {sf} data structure
data <- tidygeocoder::geo(adresses, method = "osm") %>% 
  st_as_sf(coords = c("long", "lat"), crs = 4326)

osroute <- osrm::osrmRoute(loc = data,
                           returnclass = "sf")

# sample osroute 50 times regularly, cast to POINT, return sf (not sfc) object
osroute_sampled <- st_sample(osroute, type = 'regular', size = 50) %>%
  st_cast('POINT') %>%
  st_as_sf() 


library(ggplot2)
library(ggmap) # warning: has a naming conflict with tidygeocoder!
library(gganimate)

# ggmap does not quite like geom_sf(), 
# the "old school" geom_point will be easier to work with
osroute_xy <- osroute_sampled %>% 
  mutate(seq = 1:nrow(.),
         x = st_coordinates(.)[,"X"],
         y = st_coordinates(.)[,"Y"]) 

# basemap / the bbox depends on yer area of interest
NYC <- get_stamenmap(bbox = c(-74.05, 40.68, -73.9, 40.8),
                     zoom = 13,
                     maptype = "toner-background")

# draw a map 
animation <- ggmap(NYC) + 
  geom_point(data = osroute_xy,
             aes(x = x, y = y),
             color = "red",
             size = 4) +
  theme_void() +
  transition_reveal(seq) +
  shadow_wake(wake_length = 1/6)

# create animation
gganimate::animate(animation, 
                   nframes = 2*(nrow(osroute_xy)+1), 
                   height = 800, 
                   width = 760,
                   fps = 10, 
                   renderer = gifski_renderer(loop = T))

# save animation  
gganimate::anim_save('animated_nyc.gif')

animated map of a car in nyc


非常感谢 @Jindra Lacko。我想知道您能否帮助我构建它的最后一部分-https://stackoverflow.com/questions/68908920/create-animation-of-vehicle-moving-along-a-route-with-timeline-of-events - SiH

8
这里有一个使用{mapdeck}的方法,它可以为您提供交互式地图(类似于leaflet),并且可以轻松处理数千个旅行路线。以下是示例动画:enter image description here
library(mapdeck)

set_token( secret::get_secret("MAPBOX") )

mapdeck(
  location = as.numeric( data[1, ]$geometry[[1]] ) ## for 'trips' you need to specify the location
  , zoom = 12
  , style = mapdeck_style("dark")
) %>%
  add_trips(
    data = sf
    , stroke_colour = "#FFFFFF" #white
    , trail_length = 12
    , animation_speed = 8
    , stroke_width = 50
  )

add_trips() 函数接受一个带有Z和M维度(z = 海拔,m = 时间)的 sf linestring 对象。因此,您可以将时间戳与每个坐标相关联。

library(mpadeck)
library(sfheaders)


df_route <- sfheaders::sf_to_df(osroute, fill = TRUE)

## Assume 'duration' is constant
## we want the cumulative time along the rute
df_route$cumtime <- cumsum(df_route$duration)


## and we also need a Z component.
## since we don't know the elevation, I'm setting it to '0'
df_route$elevation <- 0

## Build the 'sf' object wtih the Z and M dimensions
sf <- sfheaders::sf_linestring(
  obj = df_route
  , x = "x"
  , y = "y"
  , z = "elevation"
  , m = "cumtime"
)


网站上有更多详细信息。


谢谢SymbolixAU。我想知道您是否也可以查看此问题的后续 - https://stackoverflow.com/questions/68908920/create-animation-of-vehicle-moving-along-a-route-with-timeline-of-events - SiH

3

对于指定数量的采样路径(即一个LINESTRING),可使用lapply函数创建地图对象,并使用tmap_animate进行动画展示。

在您上述的代码中添加以下内容:

library(tmap)
library(gifski)

# sample osroute 50 times regularly, cast to POINT, return sf (not sfc) object
osroute_sampled <- st_sample(osroute, type = 'regular', size = 50) %>%
  st_cast('POINT') %>%
  st_as_sf() 


# use lapply to crate animation maps. taken from reference page:
#  https://mtennekes.github.io/tmap/reference/tmap_animation.html

m0 <- lapply(seq_along(1:nrow(osroute_sampled)), function(point){
  x <- osroute_sampled[point,]   ## bracketted subsetting to get only 1 point
  tm_shape(osroute) +            ## full route
    tm_sf() +
    tm_shape(data) +             ## markers for start/end points
    tm_markers() +
    tm_shape(x) +                ## single point
    tm_sf(col = 'red', size = 3)
})

# Render the animation
tmap_animation(m0, width = 300, height = 600, delay = 10)

我已经有一段时间没有使用tmap了,所以我不太清楚如何添加提供者瓦片地图。对于你来说,在lapply函数中添加这些内容应该不难。

输入图像描述在这里

谢谢mrhellmann很快回复了这个帖子。我想知道您是否也可以看一下这个问题的跟进 - https://stackoverflow.com/questions/68908920/create-animation-of-vehicle-moving-along-a-route-with-timeline-of-events - SiH

网页内容由stack overflow 提供, 点击上面的
可以查看英文原文,
原文链接