我想知道是否可以将flextable/regulartable、ggplot、文本和图像组合成一个网格对象,然后将该网格放在PowerPoint幻灯片中?这对于在幻灯片中排列对象而不必计算每个对象的坐标非常有用。我看到了通过grid.arrange组合和排列ggplot对象的示例(r-为什么我不能使用OfficeR将一组图形放在网格中发送到PowerPoint?)但如果我想添加一个flextable或者可能是一个新的文本段落,它就无法工作了。是否有一种使用网格布局改善演示层的方法?谢谢!
将一个Flextable、一个ggplot、一段文本和一张图片组合在一起成为一个网格对象,然后将其添加到PowerPoint幻灯片中。
4
- Popescu Gabriel
1个回答
6
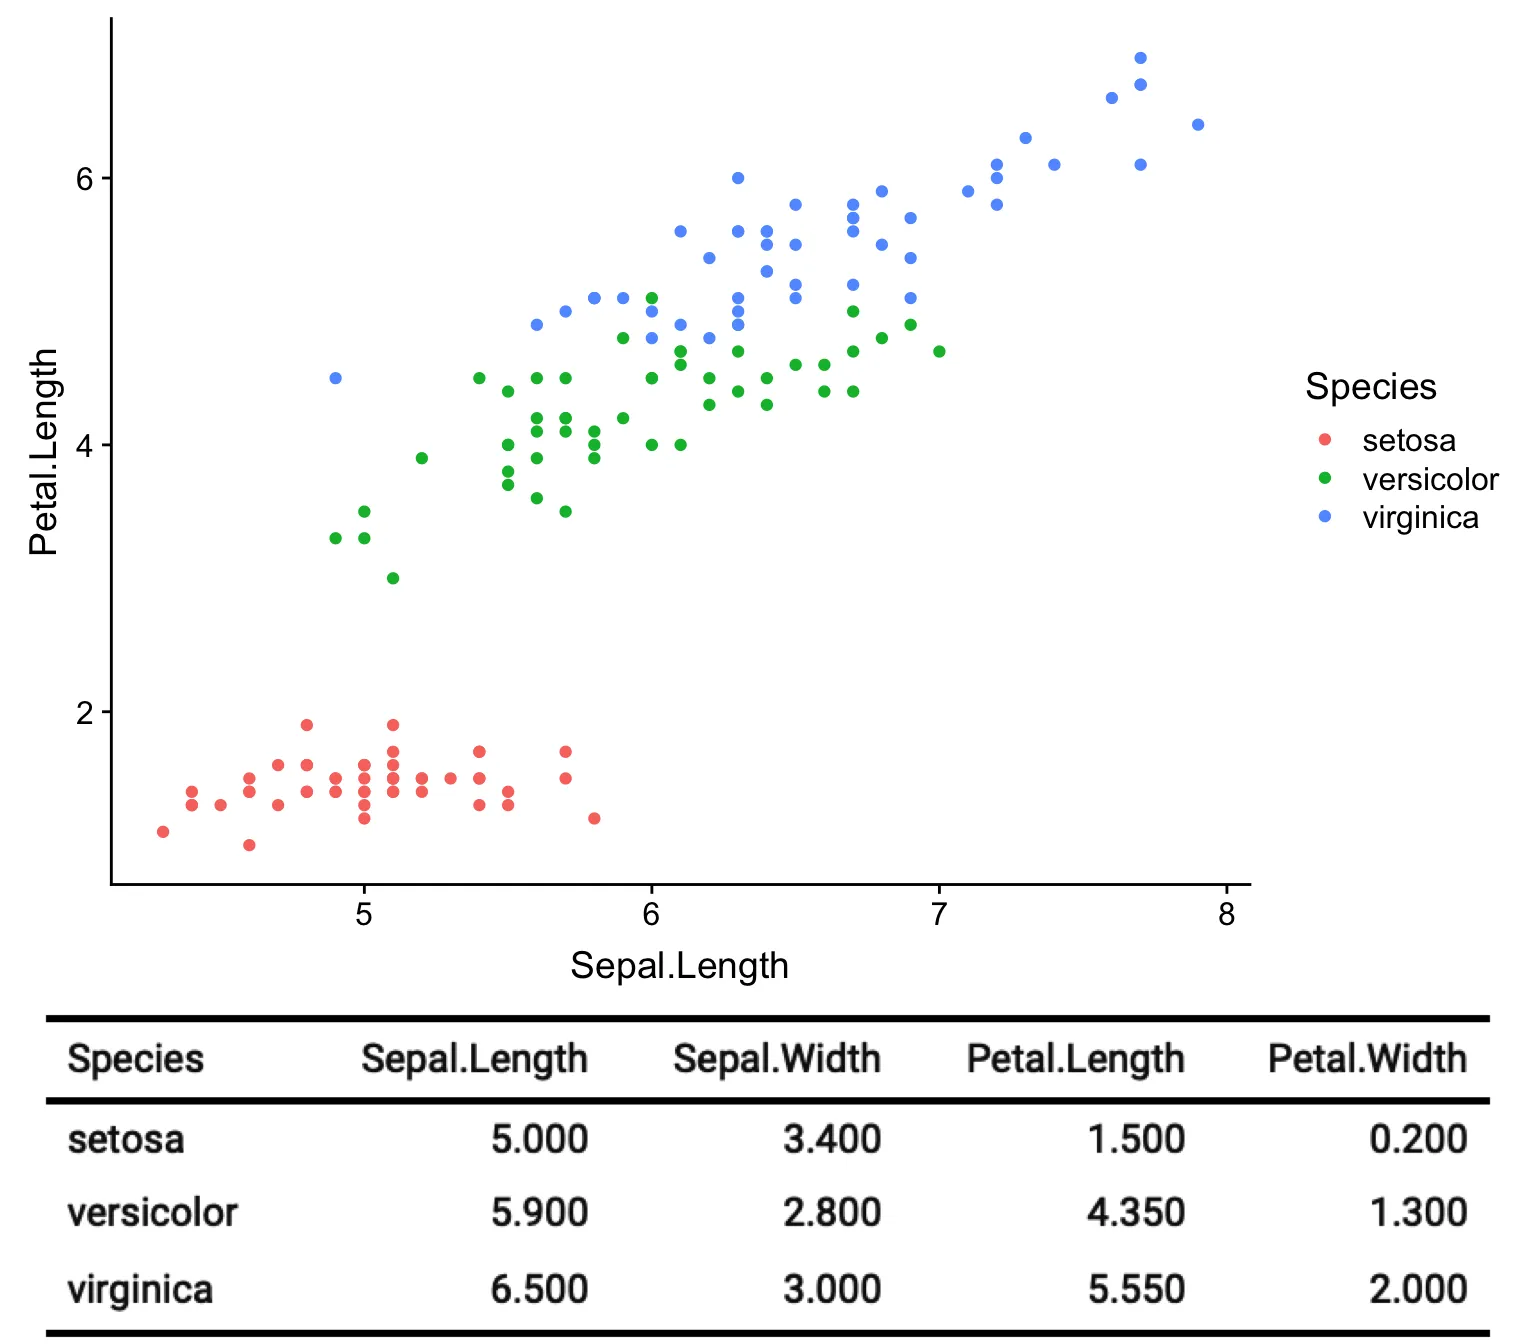
自从flextable 0.5.3 版本以来,这是有可能的。有很多方法可以实现,以下是一个示例:
library(ggplot2)
library(grid)
library(cowplot)
library(dplyr)
# remotes::install_github("davidgohel/flextable")
library(flextable)

gg1 <- ggplot(iris, aes(Sepal.Length, Petal.Length, color = Species) ) + geom_point()

ft_raster <- iris %>% group_by(Species) %>%
  summarise_all(median) %>%
  flextable() %>% autofit() %>%
  as_raster()

gg2 <- ggplot() +
  theme_void() +
  annotation_custom(rasterGrob(ft_raster), xmin=-Inf, xmax=Inf, ymin=-Inf, ymax=Inf)

cowplot::plot_grid(gg1, gg2, nrow = 2, ncol = 1, rel_heights = c(3, 1) )
以下是结果:
- David Gohel
1
网页内容由stack overflow 提供, 点击上面的可以查看英文原文,
原文链接
原文链接
- 相关问题
- 5 R文本挖掘 - 将段落一个接一个地组合在一起,而不会混淆句子
- 7 将一个单词样式(表格或段落)应用于flextable对象
- 4 从PowerPoint幻灯片中提取图表数据
- 5 如何更新PowerPoint幻灯片中所有日期/时间数值(VBA)
- 7 使用点击动画在PowerPoint幻灯片中通过编程推进
- 3 将Excel图表粘贴到PowerPoint幻灯片中
- 5 如何在RMarkdown中将多个图形添加到PowerPoint幻灯片中?
- 65 如何在PowerPoint幻灯片中命名一个对象?
- 3 在PowerPoint幻灯片中插入形状(Office Javascript API)
- 8 将图片添加到ggplot标题
magick的包,而我无法使用它。还有其他方法吗?我正在使用 flextable 版本 0.5.9。 - PeterD