我有一个时间序列:
x

4557  9940  9855  9894 10142  9501  9532  9229  9169  9214  9347  9176  8951  9344  9873  9970
9139  9420  9476  9205  9271  8632  8730  9336  9150  9601 10012  9841  9951  9222  8799  9316
10087  9677  9154  9019 10549  9629  9131  9560 10246 10982 11748  9054  8690  9923

tt<-1:length(x)

plot(x, xaxt = "n", type = "l", xlab = NULL, ylab = NULL, col = "royalblue2", lwd = 2.3)
我想添加线性趋势:
fit <- lm(x ~ tt)
co <- coef(fit)
co
    (Intercept)             tt

    8940.23478           21.27031
然后我需要找到两条红线之间的角度:
abline(8940.23478, 21.27031, col = "red", lwd = 2)
abline(8940.23478, 0, col = "red", lwd = 2)
我该如何管理它?
这是我的图表: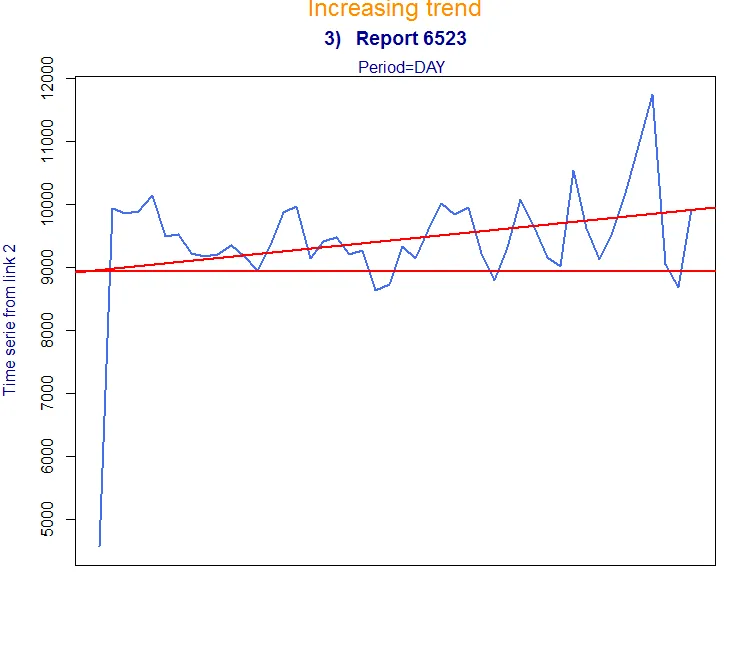
angle = atan(abs((m2-m1)/(1+m1*m2)))- Nishanth