我有两条不规则的线,作为[x,y]坐标列表,其中有峰值和谷底。列表的长度可能略有变化(不等)。我想测量它们的相似性,以检查类似深度或高度的峰值和谷底是否以适当的间隔出现,并给出相似性度量。我想在Python中完成这个任务。是否有任何内置函数可以做到这一点?
我有两条不规则的线,作为[x,y]坐标列表,其中有峰值和谷底。列表的长度可能略有变化(不等)。我想测量它们的相似性,以检查类似深度或高度的峰值和谷底是否以适当的间隔出现,并给出相似性度量。我想在Python中完成这个任务。是否有任何内置函数可以做到这一点?
我不知道Python中是否有内置函数可以实现此操作。
我可以给你列出Python生态系统中可能使用的函数列表。这绝不是所有函数的完整列表,可能还有很多我不知道的方法。
如果数据已排序,但您不知道哪个数据点是第一个,哪个数据点是最后一个:
如果数据已排序,并且您知道第一个和最后一个点是正确的:
*通常用于各种机器学习任务的数学方法
**我用来识别唯一材料滞回响应的方法
首先,让我们假设我们有两个完全相同的随机X Y数据。请注意,所有这些方法都将返回零。如果您没有安装similaritymeasures,请从pip中安装。
import numpy as np
from scipy.spatial.distance import directed_hausdorff
import similaritymeasures
import matplotlib.pyplot as plt

# Generate random experimental data
np.random.seed(121)
x = np.random.random(100)
y = np.random.random(100)
P = np.array([x, y]).T

# Generate an exact copy of P, Q, which we will use to compare
Q = P.copy()

dh, ind1, ind2 = directed_hausdorff(P, Q)
df = similaritymeasures.frechet_dist(P, Q)
dtw, d = similaritymeasures.dtw(P, Q)
pcm = similaritymeasures.pcm(P, Q)
area = similaritymeasures.area_between_two_curves(P, Q)
cl = similaritymeasures.curve_length_measure(P, Q)

# all methods will return 0.0 when P and Q are the same
print(dh, df, dtw, pcm, cl, area)
打印输出为0.0、0.0、0.0、0.0、0.0、0.0。这是因为曲线P和Q完全相同!
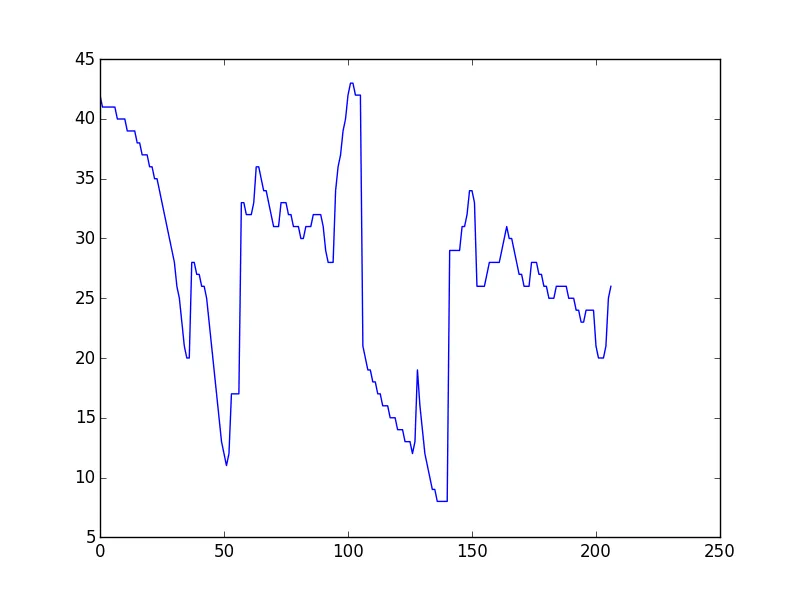
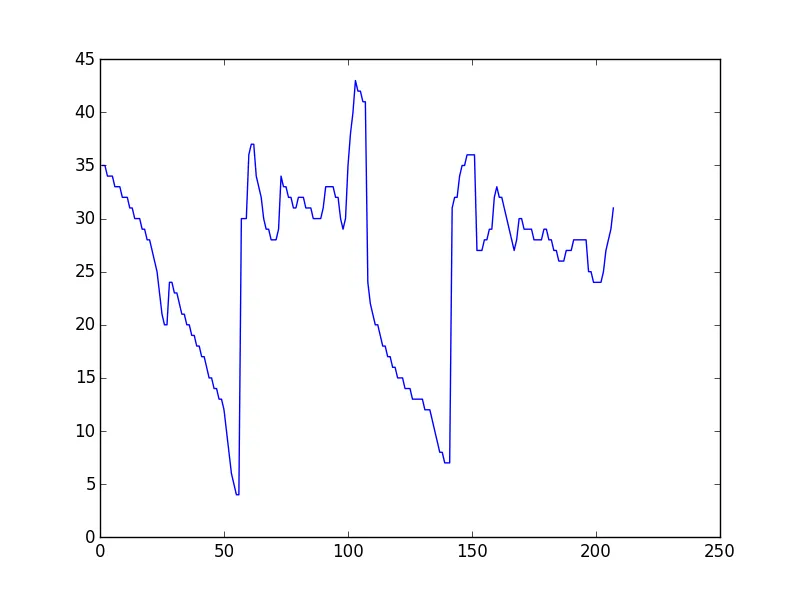
现在假设P和Q是不同的。
# Generate random experimental data
np.random.seed(121)
x = np.random.random(100)
y = np.random.random(100)
P = np.array([x, y]).T

# Generate random Q
x = np.random.random(100)
y = np.random.random(100)
Q = np.array([x, y]).T

dh, ind1, ind2 = directed_hausdorff(P, Q)
df = similaritymeasures.frechet_dist(P, Q)
dtw, d = similaritymeasures.dtw(P, Q)
pcm = similaritymeasures.pcm(P, Q)
area = similaritymeasures.area_between_two_curves(P, Q)
cl = similaritymeasures.curve_length_measure(P, Q)

# all methods will return 0.0 when P and Q are the same
print(dh, df, dtw, pcm, cl, area)
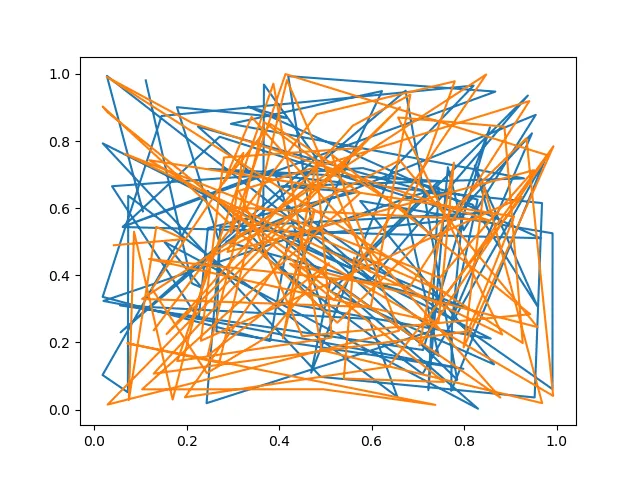
plt.figure()
plt.plot(P[:, 0], P[:, 1])
plt.plot(Q[:, 0], Q[:, 1])
plt.show()
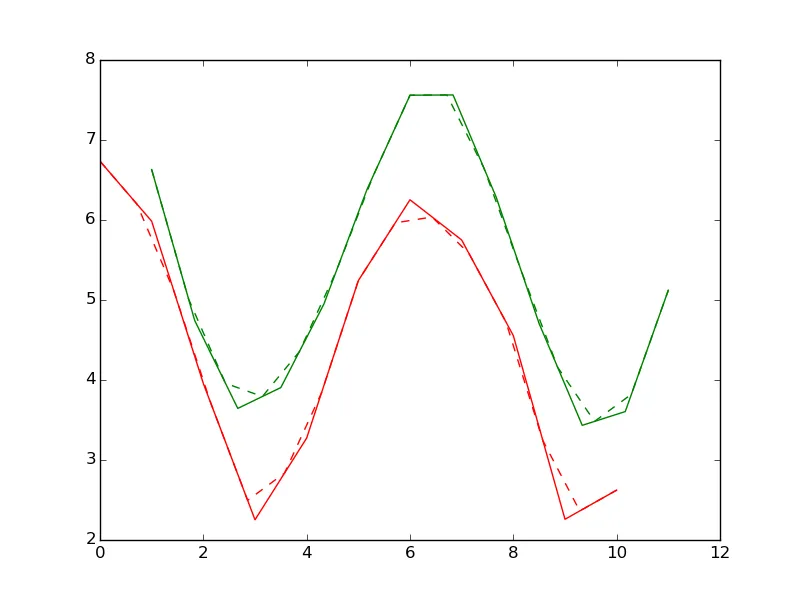
由于你的数组大小不同(我假设你是同时获取的),需要插值以便在相关点上进行比较。以下代码可以执行此操作,并计算相关度量:
#!/usr/bin/python
import numpy as np
from scipy.interpolate import interp1d
import matplotlib.pyplot as plt
import scipy.spatial.distance as ssd
import scipy.stats as ss

x = np.linspace(0, 10, num=11)
x2 = np.linspace(1, 11, num=13)

y = 2*np.cos( x) + 4 + np.random.random(len(x))
y2 = 2* np.cos(x2) + 5 + np.random.random(len(x2))

# Interpolating now, using linear, but you can do better based on your data
f = interp1d(x, y)
f2 = interp1d(x2,y2)

points = 15

xnew = np.linspace ( min(x), max(x), num = points)
xnew2 = np.linspace ( min(x2), max(x2), num = points)

ynew = f(xnew)
ynew2 = f2(xnew2)
plt.plot(x,y, 'r', x2, y2, 'g', xnew, ynew, 'r--', xnew2, ynew2, 'g--')
plt.show()

# Now compute correlations
print ssd.correlation(ynew, ynew2) # Computes a distance measure based on correlation between the two vectors
print np.correlate(ynew, ynew2, mode='valid') # Does a cross-correlation of same sized arrays and gives back correlation
print np.corrcoef(ynew, ynew2) # Gives back the correlation matrix for the two arrays

print ss.spearmanr(ynew, ynew2) # Gives the spearman correlation for the two arrays
输出:
0.499028272458

[ 363.48984942]

[[ 1.          0.50097173]
 [ 0.50097173  1.        ]]

SpearmanrResult(correlation=0.45357142857142857, pvalue=0.089485900143027278)
请记住,这里的相关性是参数化和皮尔逊类型,并假定单调性以计算相关性。如果不是这种情况,并且您认为您的数组只是一起改变符号,您可以像最后一个示例中那样使用Spearman's相关性。
我不知道有没有内置函数,但是你可以修改Levenshtein距离。下面的代码来自于wikibooks。
def point_distance(p1, p2):
    # Define distance, if they are the same, then the distance should be 0


def levenshtein_point(l1, l2):
    if len(l1) < len(l2):
        return levenshtein(l2, l1)

    # len(l1) >= len(l2)
    if len(l2) == 0:
        return len(l1)

    previous_row = range(len(l2) + 1)
    for i, p1 in enumerate(l1):
        current_row = [i + 1]
        for j, p2 in enumerate(l2):
            print('{},{}'.format(p1, p2))
            insertions = previous_row[j + 1] + 1 # j+1 instead of j since previous_row and current_row are one character longer
            deletions = current_row[j] + 1       # than l2
            substitutions = previous_row[j] + point_distance(p1, p2)
            current_row.append(min(insertions, deletions, substitutions))
        previous_row = current_row

    return previous_row[-1]