我一直在Google图表游乐场里尝试着使用Google图表,这是游乐场的链接:
我一直在使用以下代码:
function drawVisualization() {
// Create and populate the data table.
var data = google.visualization.arrayToDataTable([
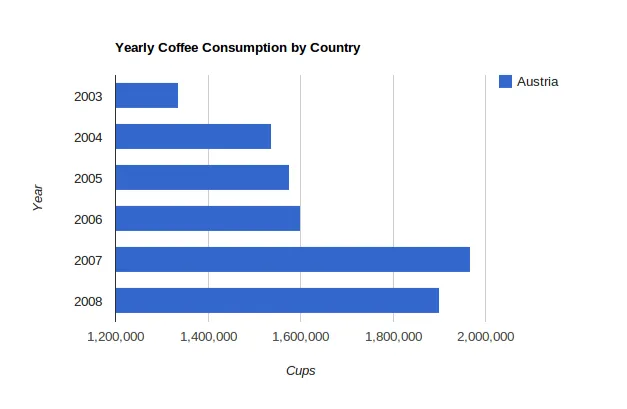
['Year', 'Austria'],
['2003', 1336060],
['2004', 1538156],
['2005', 1576579],
['2006', 1600652],
['2007', 1968113],
['2008', 1901067]
]);
// Create and draw the visualization.
new google.visualization.BarChart(document.getElementById('visualization')).
draw(data,
{title:"Yearly Coffee Consumption by Country",
width:600, height:400,
vAxis: {title: "Year"},
hAxis: {title: "Cups"}}
);
}
这给了我一个漂亮的图表,如下所示:
我想让这个图表适合我的网站需求,为此,我需要将左侧柱形图名称转换为链接到另一页的链接。例如,2003年将是用户可以单击的链接,以及2004年等等。
我尝试过类似以下的内容:
function drawVisualization() {
  // Create and populate the data table.
  var data = google.visualization.arrayToDataTable([
    ['Year', 'Austria'],
    ['<a href="url">Link text</a>',  1336060],
    ['2004',  1538156],
    ['2005',  1576579],
    ['2006',  1600652],
    ['2007',  1968113],
    ['2008',  1901067]
  ]);

  // Create and draw the visualization.
  new google.visualization.BarChart(document.getElementById('visualization')).
      draw(data,
           {title:"Yearly Coffee Consumption by Country",
            width:600, height:400,
            vAxis: {title: "Year"},
            hAxis: {title: "Cups"}}
      );
}
但我只能希望它是那么容易,但事实并非如此。有人知道这是否有可能吗?