使用str()查看'x'对象,你会看到这个:
..@ data    :Formal class '.MultipleRasterData' [package "raster"] with 14 slots
  .. .. ..@ values    : num [1:2500, 1:3] 255 248 221 199 198 210 221 190 104 79 ...
  .. .. .. ..- attr(*, "dimnames")=List of 2
  .. .. .. .. ..$ : NULL
  .. .. .. .. ..$ : chr [1:3] "red" "green" "blue"
...所以1:50乘1:50的值被映射到三列。X值可能是0:2500 %% 50,y值可能是0:2500 %/% 50
因此请记住,光栅对象的“原点”为左上角,而绘图函数的“原点”为左下角,因此y值为20变为50-20或30,这就给出了你所要求的结果(抱歉将y序列放在第一位):
x@data@values[( ((1:2500 %/% 50 )- 30)^2 + ((1:2500 %% 50) - 20)^2 ) >=100, 1] <- 0
x@data@values[( ((1:2500 %/% 50 )- 30)^2 + ((1:2500 %% 50) - 20)^2 ) >=100, 2] <- 0
x@data@values[( ((1:2500 %/% 50 )- 30)^2 + ((1:2500 %% 50) - 20)^2 ) >=100, 3] <- 0
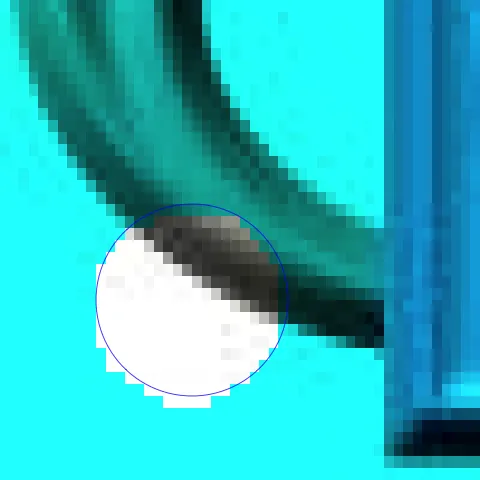
plotRGB(x)
draw.circle(20,20,10,border="blue")

The logic is that the criteria are of the form (x-dx)^2+(y-dy)^2 > r^2 where dx and dy are the center coordinates of the circle and r is the radius == 10.
对于每个颜色层,具有命名参数的代码将类似于制作最暗的“红色”代码。这会给出一个大致的圆形掩模,尽管正确处理中心线不是很好。
x@data@values[( ((1:(height*width) %/% (height*5/4) )- (height-circley*5/4) )^2 +
            ((1:(height*width) %% width) -       circlex )^2 ) >= radius^2, 1] <- 0
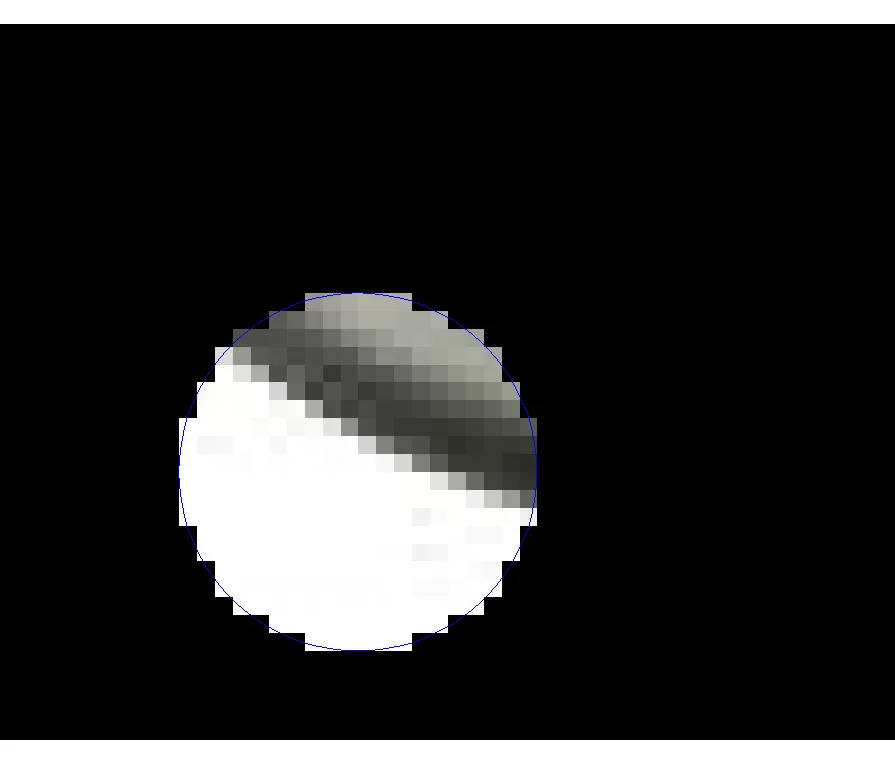
进一步的实验得出了这个结果,看起来非常接近:
x@data@values[( ((1:(height*width) %/% (height) )- (height-circley) *5/4)^2 +
                 ((1:(height*width) %% width) -       circlex )^2 ) >= radius^2, 1] <- 0
plotRGB(x, asp=5/4, addfun=function() draw.circle(circlex,circley,radius,border="blue") )
显然,你可以在所有出现5/4的地方将
宽度/高度缩放因子替换为新的纵横比。
r1 <- brick("/mypath/results_circle.jpg")读取JPEG图像。 - user2543622str(r1)的完整输出。我真的认为我已经完全回答了这个问题。 - IRTFM