我知道您可以使用Label()函数向图表添加自定义标签,但是您必须指定(x,y)坐标来放置标签。
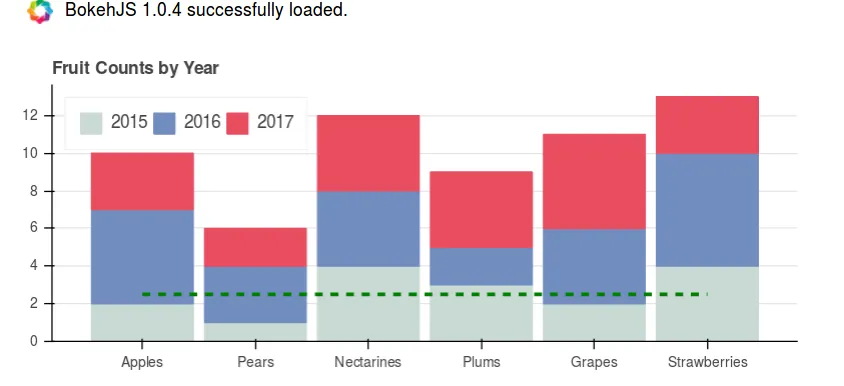
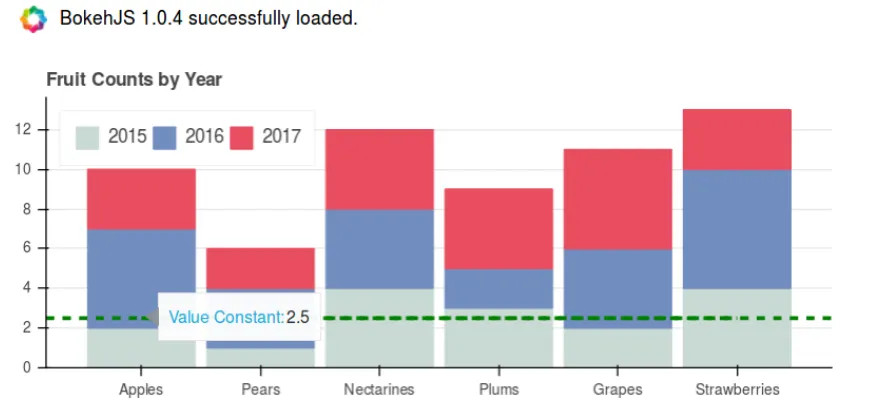
我有一些时间序列数据的注释,正在使用Span()添加到图表中,但我真正想要的是如果我可以将标签添加到这些Span注释中,每当您悬停在Span对象上时就会显示出来。这似乎是一件简单的事情,但我真的很困惑。
这是我一直在研究的示例代码:
我有一些时间序列数据的注释,正在使用Span()添加到图表中,但我真正想要的是如果我可以将标签添加到这些Span注释中,每当您悬停在Span对象上时就会显示出来。这似乎是一件简单的事情,但我真的很困惑。
这是我一直在研究的示例代码:
p = figure(x_axis_type='datetime', y_axis_type='datetime', tools='hover')

p.line(daylight_warsaw_2013.Date,daylight_warsaw_2013.Sunset, line_dash='solid', line_width=2, legend="Sunset")
p.line(daylight_warsaw_2013.Date,daylight_warsaw_2013.Sunrise, line_dash='dotted', line_width=2, legend="Sunrise")


annotations = {
    'start':{'timestamp':dt(2013, 3, 31,2,0,0),'desc':"start of daylight savings time"},
    'end':{'timestamp':dt(2013, 10, 27, 3, 0, 0),'desc':"end of daylight savings time"}
}

def auto_annotate(df,plot):
    for row in df.values():
        xloc = time.mktime(row['timestamp'].timetuple())*1000
        span = Span(location=xloc, dimension='height', line_width=2, line_dash='dashed',line_color='green')
        label = Label(x=xloc, y=5000000, text=row['desc'])
        plot.add_layout(label)
        plot.add_layout(span)

auto_annotate(annotations,p)
show(p)
请记住,我不知道如何使用JavaScript。