Python IndexError: 索引1超出了LDA的范围

4

我有一个看起来像这样的数据集:

    Out  Revolver   Ratio     Num ...
0   1    0.766127   0.802982  0   ...
1   0    0.957151   0.121876  1 
2   0    0.658180   0.085113  0 
3   0    0.233810   0.036050  3 
4   1    0.907239   0.024926  5 
...

Out 只能取值 0 和 1。 
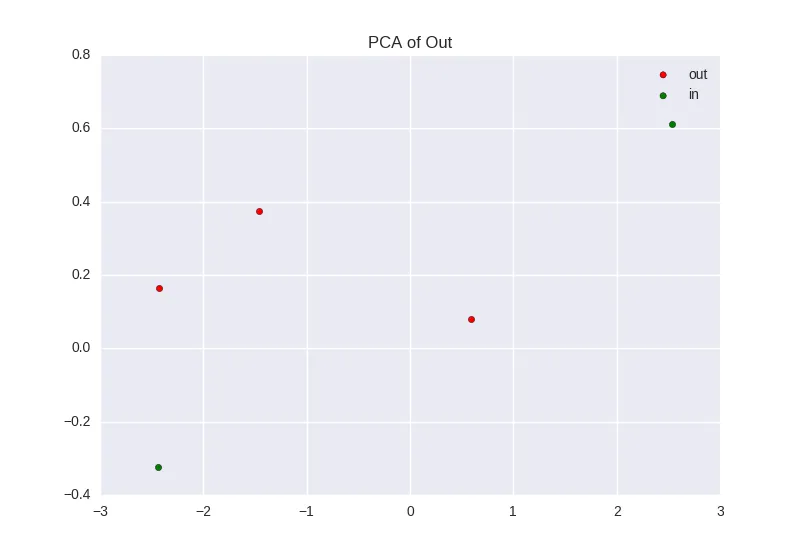
然后我尝试使用下面的代码生成类似于这里的 PCA 和 LCA 图:http://scikit-learn.org/stable/auto_examples/decomposition/plot_pca_vs_lda.html

features = Train.columns[1:]
Xf = newTrain[features]
yf = newTrain.Out
pca = PCA(n_components=2)
X_r = pca.fit(Xf).transform(Xf)
lda = LinearDiscriminantAnalysis(n_components=2)
X_r2 = lda.fit(Xf, yf).transform(Xf)

plt.figure()
for c, i, name in zip("rgb", [0, 1], names):
    plt.scatter(X_r[yf == i, 0], X_r[yf == i, 1], c=c, label=name)
plt.legend()
plt.title('PCA plt')

plt.figure()
for c, i, name in zip("rgb", [0, 1], names):
    plt.scatter(X_r2[yf == i, 0], X_r2[yf == i, 1], c=c, label=name)
plt.legend()
plt.title('LDA plt')

我可以让PCA图表正常工作。然而,它只显示两个点,这是没有意义的。一个位于(-4000,30)左右,另一个位于(2400,23.7)。我没有看到像该链接中的图表中那样的大量数据点。
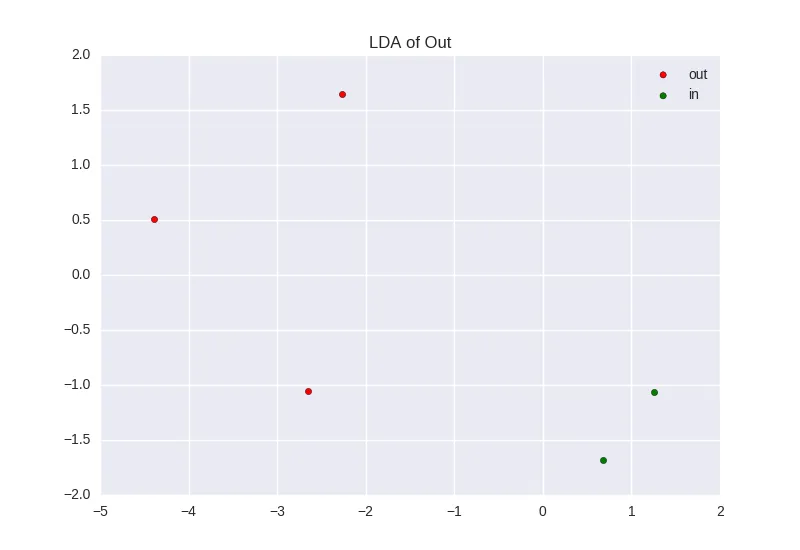
LDA图表无法正常工作,出现了以下错误:
IndexError:轴1的大小为1,索引1超出了范围。
我还尝试使用下面的代码生成LDA图表,但出现了相同的错误。
for c, i, name in zip("rgb", [0, 1], names):
    plt.scatter(x=X_LDA_sklearn[:, 0][yf==i], y=X_LDA_sklearn[:, 1][yf==i], c=c, label=name)
plt.legend()

有人知道这是什么问题吗?

编辑:这是我的导入内容

import pandas as pd
from pandas import Series,DataFrame
import numpy as np
import matplotlib.pyplot as plt
import seaborn as sns
import csv

from sklearn.linear_model import LogisticRegression
from sklearn.cross_validation import train_test_split
from sklearn import metrics
from sklearn.decomposition import PCA
from sklearn.discriminant_analysis import LinearDiscriminantAnalysis
from sklearn.lda import LDA

关于错误发生的位置:
我得到了:
FutureWarning: in the future, boolean array-likes will be handled as a boolean array index
plt.scatter(X_r[yf == i,0], X_r[yf == i, 1], c=c, label=name)

在PCA图的for循环内部的那一行

至于LDA,在那一行

plt.scatter(X_r2[yf == i, 0], X_r2[yf == i, 1], c=c, label=name)

我明白了

FutureWarning: in the future, boolean array-likes will be handled as a boolean array index

并且

IndexError: index 1 is out of bounds for axis 1 with size 1

1
你能添加你的 import 语句并告诉我们出现错误的行吗? - Cleb
1
TrainnewTrain是如何定义的?你是如何读取数据的?显然这是一个维度问题,如果你告诉我们你是如何创建所使用的数据的,那将会非常有帮助 :) - Cleb
你可以在http://pastebin.com/bDee3TtZ看到我的代码。那个pastebin里我忘了一件事:我忘记在all_cols=上面加入一行X=trainDF - user5739619
1
我找到了错误并纠正了代码。请告诉我这是否解决了你的问题。 - Cleb
1个回答

2
你看到这个错误的原因是X_r2只包含了一列数据(至少根据你提供的数据)。在命令y=X_LDA_sklearn[:, 1][yf==i]中,你试图访问第二列,但由于只有一列,所以出现了你观察到的错误。
我添加了一个第三类到你提供的示例数据中(对于两个类来说,降维不是那么合理),并将你的数据框转换为数组。现在它可以很好地运行,并产生以下图表(由于数据量较小而不是那么信息丰富): enter image description here enter image description here 下面是更新后的代码:
import pandas as pd
from pandas import Series,DataFrame
import numpy as np
import matplotlib.pyplot as plt
import seaborn as sns
import csv

from sklearn.linear_model import LogisticRegression
from sklearn.cross_validation import train_test_split
from sklearn import metrics
from sklearn.decomposition import PCA
from sklearn.discriminant_analysis import LinearDiscriminantAnalysis

trainDF = pd.DataFrame({'Out': [1, 0, 0, 0, 1, 3, 3],
                        'Revolver': [0.766, 0.957, 0.658, 0.233, 0.907, 0.1, 0.15],
                        'Ratio': [0.803, 0.121, 0.085, 0.036, 0.024, 0.6, 0.8],
                        'Num': [0, 1, 0, 3, 5, 4, 4]})
#drop NA values
trainDF = trainDF.dropna()

trainDF['Num'].loc[(trainDF['Num']==8) | (trainDF['Num']==17)] = trainDF['Num'].median()

# convert dataframe to numpy array
y = trainDF['Out'].as_matrix()

# convert dataframe to numpy array
X = trainDF.drop('Out', 1).as_matrix()

target_names = ['out', 'in']

pca = PCA(n_components=2)
X_r = pca.fit(X).transform(X)

lda = LinearDiscriminantAnalysis(n_components=2)
X_r2 = lda.fit(X, y).transform(X)

# Percentage of variance explained for each components
print('explained variance ratio (first two components): %s'
      % str(pca.explained_variance_ratio_))

plt.figure()
for c, i, target_name in zip("rgb", [0, 1], target_names):
    plt.scatter(X_r[y == i, 0], X_r[y == i, 1], c=c, label=target_name)
plt.legend()
plt.title('PCA of Out')

plt.figure()
for c, i, target_name in zip("rgb", [0, 1], target_names):
    plt.scatter(X_r2[y == i, 0], X_r2[y == i, 1], c=c, label=target_name)
plt.legend()
plt.title('LDA of Out')

plt.show()

因此,当您遇到“索引超出范围”错误时,请始终首先检查您的数组的尺寸。

1
非常感谢您的帮助。我只有一个顾虑。我非常注重隐私,所以如果您可以将target_names更改为其他名称,例如[out,in],并将plt.title更改为类似于plt.title('PCA of Out')的内容,我将不胜感激。谢谢。 - user5739619

网页内容由stack overflow 提供, 点击上面的
可以查看英文原文,
原文链接