我的Matlab不接受我的Latex。例如,如果我使用legend('b^{+6}\rightarrow b^{+7}'),它不会显示箭头,我该如何解决这个问题?
4个回答
7
尝试使用类似于Latex解释器的东西,如下所示
legend({'$b^{+6}\rightarrow b^{+7}$'}, 'interpreter', 'latex')
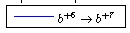
在R2012a版本下进行测试:
- herohuyongtao
4
你用的是哪个版本的Matlab?你的电脑上是否安装了Latex解释器? - herohuyongtao
学生版 R2013a - user3271929
我该如何在Linux上安装LaTeX解释器? - user3271929
@user3271929 试着重新启动Matlab,看看情况如何。 - herohuyongtao
2
在我的情况下,我必须在图例命令之后设置latex解释器:
l = legend({'$b^{+6}\rightarrow b^{+7}$'})
set(l, 'Interpreter', 'Latex');
这在Matlab R2016b中有效。
- evolved
1
对于 `xlabel` 和 `ylabel`,只需使用类似以下的内容:
由于某些原因,Matlab 在图例方面更加困难;您必须在创建图例之后设置解释器:
xlabel( ' $\Delta t$ [ sec ] ','Interpreter','latex')
由于某些原因,Matlab 在图例方面更加困难;您必须在创建图例之后设置解释器:
legend_handle = legend('$b^{+6}\rightarrow b^{+7}$');
set(legend_handle,'Interpreter','latex')
- xkcdFan1011011101111
1
如果命令...
l = legend({'$b^{+6}\rightarrow b^{+7}$'})
set(l, 'Interpreter', 'Latex');
无法正常工作,请尝试在“set”指令后加上“hold on”。
- user10129000
网页内容由stack overflow 提供, 点击上面的可以查看英文原文,
原文链接
原文链接