我想知道如何在Aptana Studio 3中使用XDebug(已经在这台机器上安装了Aptana Studio 3与XAMPP)。
您是否知道一篇最近的文章,告诉我如何做到这一点并解释XDebug?我没有任何关于XDebug的经验或知识,我查找了一些文章,但它们似乎都已过时。
WampServer:
1.) 确保XDebug接受远程调试,点击任务栏中的WampServer图标,然后进入PHP->PHP设置,确保选中“(XDebug):远程调试”,如果没有选中,请选择它并单击WampServer图标,然后选择“重新启动所有服务”。
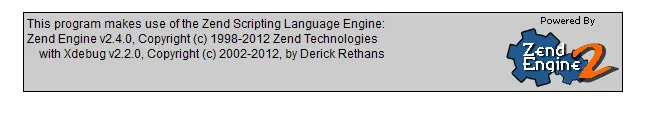
2.) 验证XDebug是否正在运行: a.) 如果您在WampServer中插入了index.php,请在URL中输入“localhost”,然后在“工具”下单击“phpinfo()”,并检查XDebug是否正在运行。在FireFox中,您应该看到以下内容:
b.) If you didn't overwrite the index.php create a file (/www_dir/phpinfo.php) with the following:
<?php
phpinfo();
?>

b.1) In FireFox enter "localhost/phpinfo.php" and look for XDebug as shown in the previous image.
Aptana Studio:
  1.) Click Window->Preferences
  2.) In the Preferences dialog go to Aptana Studio->Editors->PHP->PHP Interpreters
  3.) Click "Add..."
  4.) Enter the information like
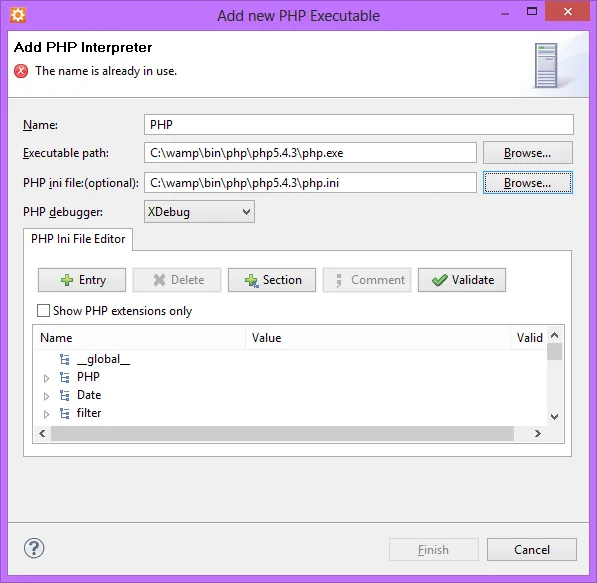
  5.) Click "OK"
  6.) Click on the debug icon and select "Debug Configurations"
  7.) Double click on "PHP Web Page"
  8.) Click the plus next to "PHP Server"

     a.) Enter a name
     b.) Base URL will be "localhost"
     c.) Document Root will be the path to your index.php
转到Aptana Studio->编辑器->PHP->PHP解释器
*****更新*****
如果您使用的是Firefox V20 +,则Firebug V1.8 +存在一些兼容性问题,基本上会破坏Firefox的上下文菜单,我找不到解决方法,所以最终选择了另一种方式,并想着我应该发布一篇文章,Aptana Studio基于Eclipse,因此我认为最好的方法是安装带有PDT的Eclipse并删除Aptana Studio...以上说明将适用于使用XDebug进行调试的所有内容
以下是一个很好的链接,介绍如何使所有内容正常工作eclipse-pdt
以下是使用Aptana Studio 3.3配置和开始使用XDebug的简易操作指南,假设您已在系统中安装了xdebug。 (在Ubuntu / Linux中,只需执行 sudo apt-get install php5-xdebug 命令即可)。
配置调试器
在“ 首选项-> Aptana Studio-> PHP-> PHP解释器”中单击添加...,并指定名称,PHP可执行文件(在大多数Linux发行版中为/ usr / bin / php),php.ini(例如,在我的系统上为/etc/php5/conf.d/20-xdebug.ini),并将PHP调试器选择为XDebug。
使用调试器
创建一个php文件并写入一些代码:
<?php

$defined_var = 'some value';

echo $defined_var;
echo $undefined_var;

exit();

?>
对我来说,只有在执行以下操作后才有效: 1. 从这里执行操作(基本上是为远程调试设置XDebug) https://jira.appcelerator.org/secure/attachment/26404/ScriptPHPDebugging.pdf 2. 安装Chrome的“XDebug助手”,FF也类似。
之后,我的远程会话就可以像在Eclipse中一样正常工作了。