add_subplot()和subplot()的区别是什么?它们似乎都可以在没有子图的情况下添加一个子图。我查看了文档,但是无法理解它们之间的区别。这只是为了使未来的代码更具灵活性吗?
例如:
fig = plt.figure()
ax = fig.add_subplot(111)
对战
plt.figure(1)
plt.subplot(111)
来自matplotlib教程。
add_subplot()和subplot()的区别是什么?它们似乎都可以在没有子图的情况下添加一个子图。我查看了文档,但是无法理解它们之间的区别。这只是为了使未来的代码更具灵活性吗?
例如:
fig = plt.figure()
ax = fig.add_subplot(111)
对战
plt.figure(1)
plt.subplot(111)
来自matplotlib教程。
ax,请使用以下内容作为参考:ax = fig.add_subplot(111)
与您分享一段时间:
plt.subplot(111)
你需要做类似这样的事情:
ax = plt.gca()
同样地,如果您希望稍后操作该图:
fig = plt.figure()
立即给您一个参考,而不是:
fig = plt.gcf()
如果您使用多个图的子图,那么获得显式引用会更加有用。比较一下:
figures = [plt.figure() for _ in range(5)]
随着:
figures = []
for _ in range(5):
    plt.figure()
    figures.append(plt.gcf())
pyplot.subplot 是 Figure.add_subplot 的封装,但行为有所不同。
使用 pyplot.subplot 创建子图时,会删除任何与其重叠超出共享边界的预先存在的 subplot。如果不想要这种行为,请改用 Figure.add_subplot 方法或 pyplot.axes 函数。 更多信息
就像Matplotlib文档所说的那样,它也在@afruzan的答案中提到。
matplotlib.pyplot.subplot:创建一个新的Axes会删除与之重叠的任何预先存在的Axes,除非仅共享边界。如果不想要这种行为,请使用Figure.add_subplot方法或pyplot.axes函数。
为了更清晰地说明,这里有个例子:
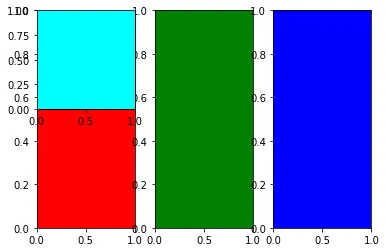
Figure.add_subplot:import matplotlib.pyplot as plt
fig = plt.figure()
fig.add_subplot(131, facecolor='red')
fig.add_subplot(132, facecolor='green')
fig.add_subplot(133, facecolor='blue')
fig.add_subplot(231, facecolor='cyan')
plt.show()
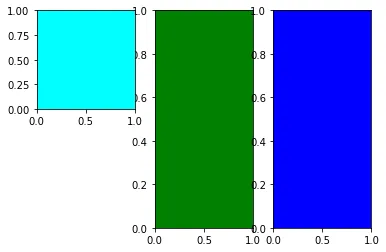
pyplot.subplot:import matplotlib.pyplot as plt
fig = plt.figure()
fig.add_subplot(131, facecolor='red')
fig.add_subplot(132, facecolor='green')
fig.add_subplot(133, facecolor='blue')
plt.subplot(231, facecolor='cyan') # overlap with subplot generated by fig.add_subplot(131, facecolor='red'), so subplot generated by fig.add_subplot(131, facecolor='red') will be removed
plt.show()
plt.subplot(111)返回一个matplotlib.axes._subplots.AxesSubplot对象,就像add_subplot一样,因此你可以使用ax = plt.subplot(111)。” - Vincenzooo