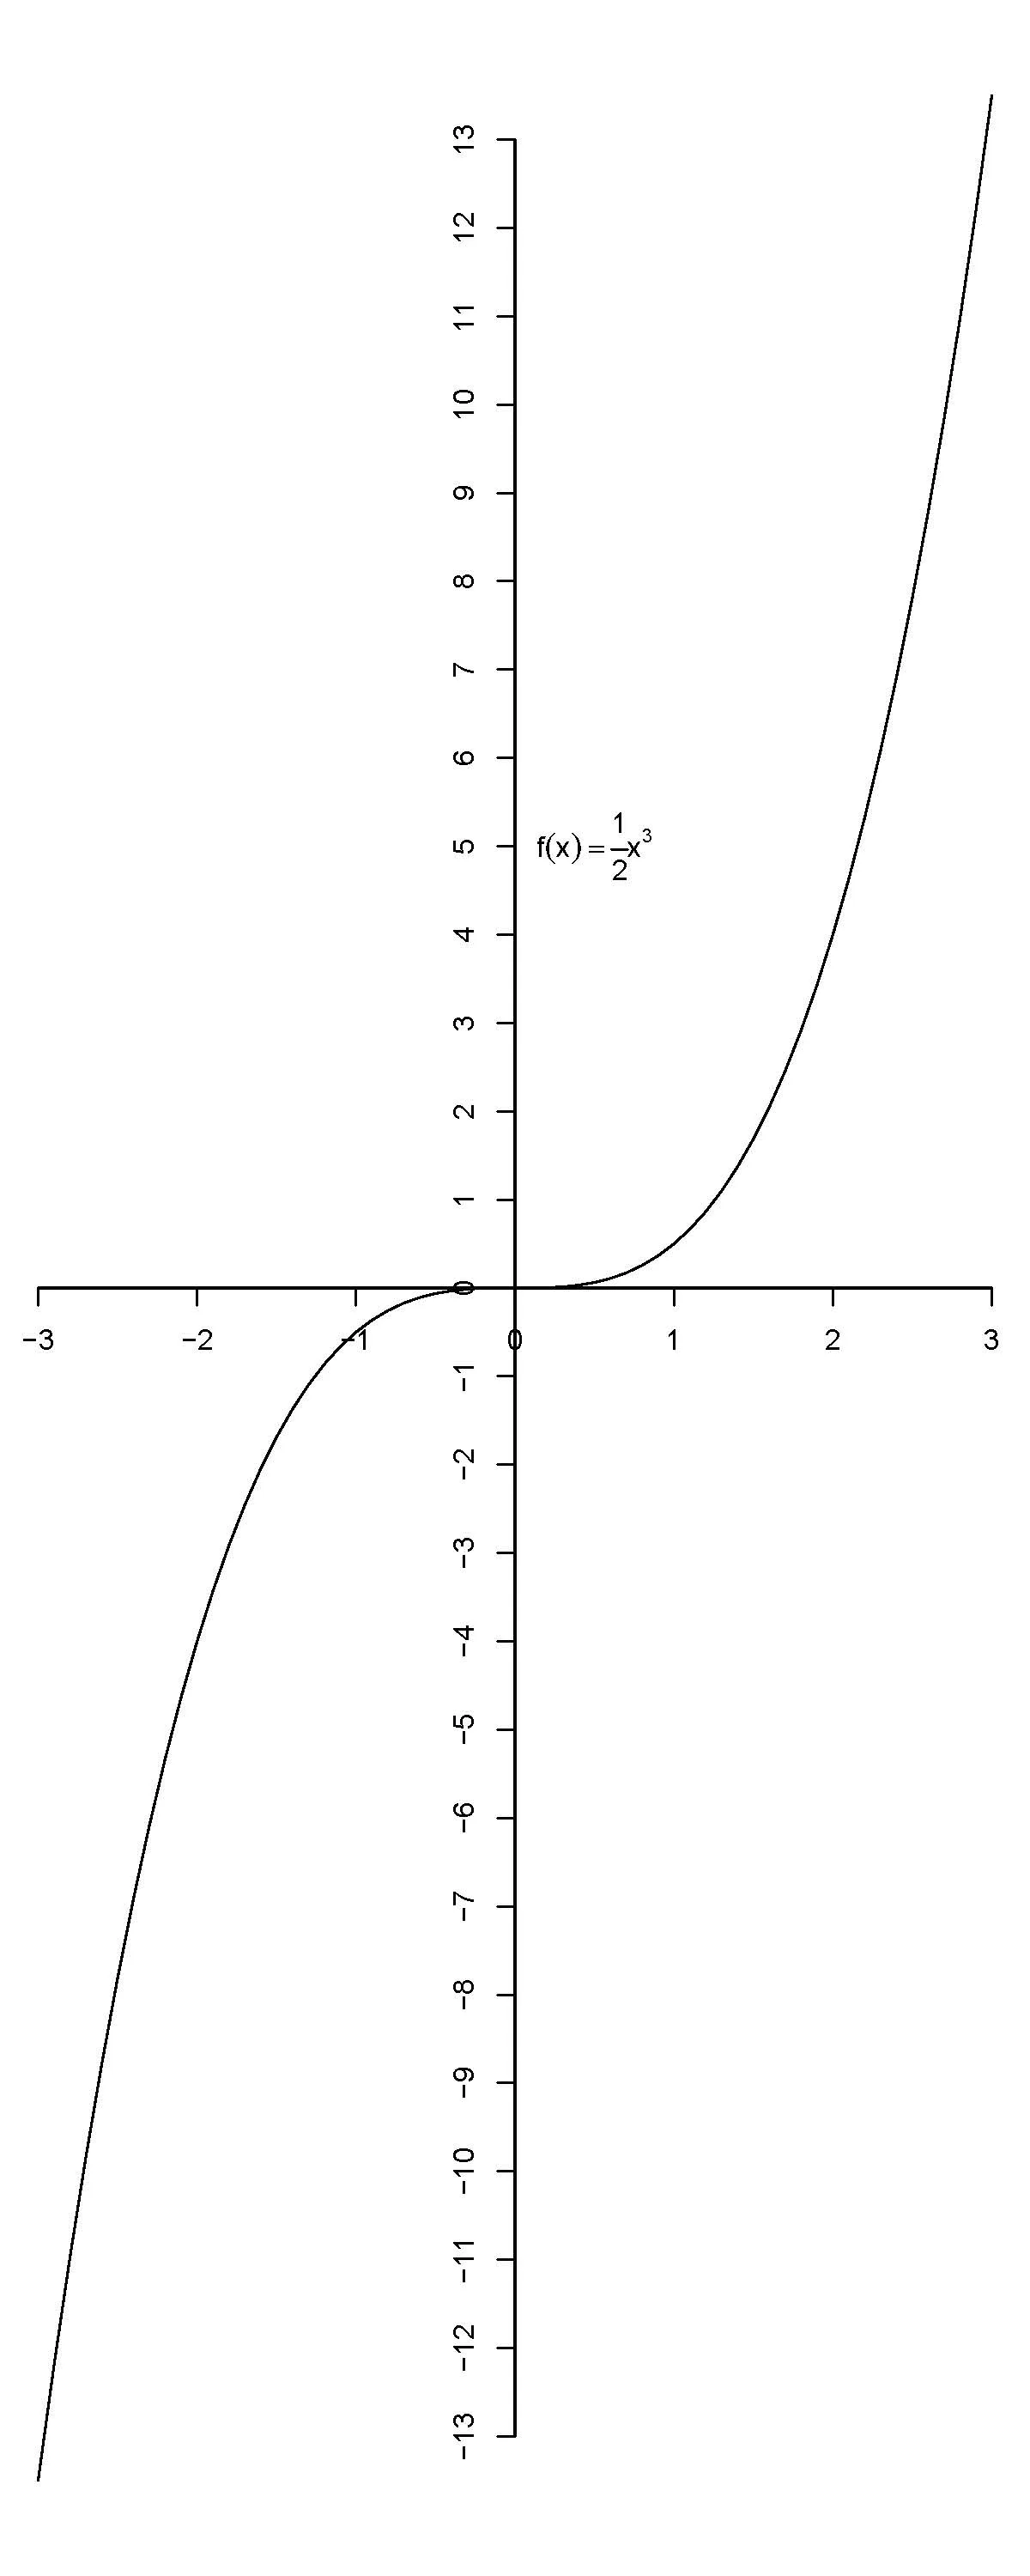
如何将刻度线的长度设置为精确的1英寸?

14
 x<-seq(-3,3,by=0.1)
 y=0.5*x^3 
 ## Set png size to be slightly bigger than plot to take account of one line margin
 png( "~/myplot.png" , width = 600 , height = 2600 ,units="px",res=100)
 ## Set graphical parameters to control the size of the plot area and the margins
 ## Set size of plot area to 6 inches wide by 15 inches tall
 par( pin = c(6,26) )
 ## Remove margins around plot area
 par( mai = c(0,0,0,0) )
 ## Remove outer margins around plot area
 par( omi = c(0,0,0,0) )
 ## Set y-axis take use entire width of plot area (6 inches) and to have 7 tick marks (-3,-2,-1,0,1,2,3)
 par( xaxp = c(-3,3,7) )
 ## Set x-axis take use entire height of plot area (26 inches) and to have 27 tick marks (-13,-12,...,0,...11,12,13)
 par( yaxp = c(-13,13,27) )
 ## Create the plot
 plot( x , y , type = "l" , frame.plot = FALSE , axes = FALSE )
 axis( 1 , pos = 0 , at = seq( -3 , 3 , by = 1 ) , labels = seq( -3 , 3 , by = 1 ) )
 axis( 2 , pos = 0 , at = seq( -13 , 13 , by = 1 ) , labels = seq( -13 , 13 , by = 1 ) )
 text(0.5,5,expression(f(x)==frac(1,2)*x^3) )
 ## Turn PNG device off
 dev.off()
我们可以获得一个宽度为6英寸,高度为26英寸的图形,但是x轴或y轴上的刻度单位不是1英寸;请查看附件g1.png。原因是R不会使用整个空间来设置x轴和y轴,而是保留一点空间,请查看附件g2.png。我可以使用png("~/myplot.png", width=610, height=2700, units="px", res=100),但如何使刻度单位的物理长度恰好为1英寸?

嗨,我已经撤销了你的一次编辑-如果您想向社区提出解决方案,请在下面使用答案框。如果您有其他问题,请提出新的问题(除非它是微不足道且高度相关的,在这种情况下,请向帮助您的回答者提问)。谢谢! - halfer
1个回答

13

为了确切地设置所需的参数,最好将输出转换为PDF格式。屏幕绘图在重新调整大小时可能会发生变化等问题。您需要设置各种图形参数来处理边距。 在base图形中有对绘图区域的良好概述和适当的par名称来进行调整请看这里。以下代码可以精确地给出您所要求的结果:

编辑

看起来 PDF 设备始终保留外部一行的边框。默认情况下,行高约为 0.2 英寸。因此,我们将宽度和高度增加 0.5 英寸,并获得 恰好 一英寸的间距。

以下是我的计算机上的测量值! enter image description here

## Set pdf size to be slightly bigger than plot to take account of one line margin
pdf( "~/myplot.pdf" , width = 6.5 , height = 15.5 )

## Set graphical parameters to control the size of the plot area and the margins
## Set size of plot area to 6 inches wide by 15 inches tall
par( pin = c(6,15) )

## Remove margins around plot area
par( mai = c(0,0,0,0) )

## Remove outer margins around plot area
par( omi = c(0,0,0,0) )

## Set y-axis take use entire width of plot area (6 inches) and to have 7 tick marks (-3,-2,-1,0,1,2,3)
par( yaxp = c(0,1,7) )

## Set x-axis take use entire height of plot area (15 inches) and to have 27 tick marks (-13,-12,...,0,...11,12,13)
par( xaxp = c(0,1,27) )

## Create the plot
plot( x , y , type = "l" , frame.plot = FALSE , axes = FALSE )
axis( 1 , pos = 0 , at = seq( -3 , 3 , by = 1 ) , labels = seq( -3 , 3 , by = 1 ) )
axis( 2 , pos = 0 , at = seq( -13 , 13 , by = 1 ) , labels = seq( -13 , 13 , by = 1 ) )
text(0.5,5,expression(f(x)==frac(1,2)*x^3) )

## Turn PDF device off
dev.off()

结果如下:

enter image description here


1
如何在y轴上添加更多的标签? - showkey
我表达的意思不太准确,现在我修改了图表,让我的意思更加清晰明了。 - showkey
@it_is_a_literature 那么您希望 x 轴总宽度为 6 英寸,y 轴总高度为 15 英寸?我目前有一个 15 英寸乘以 15 英寸的图表,y 轴长度为 13 英寸(标记之间间隔 0.5 英寸),x 轴长度为 6 英寸(标记之间间隔 1 英寸)。这个可以吗? - Simon O'Hanlon
最后一个问题:x轴的极左边缘是-3而不是0,x轴的极右边缘是3而不是1。也许可以使用par(xaxp = c(-3, 3, 7))par(yaxp = c(-13, 13, 27))来解决? - showkey
1
@it_is_a_literature 但是你在问题中放置的示例图表,之后又将其删除了(!!!),它的x轴范围是-3到3,并使用-3到3的x值。为什么会从0到1呢?这毫无意义。如果x轴值从0到1,你将如何显示此图表? xaxp中的0和1表示x轴使用绘图区域的分数(0是绘图区域的左边缘,我们将x轴设置为从那里开始并取值为-3,1是绘图区域的最右边缘,x轴结束并取值为3),xaxp与绝对值无关。 - Simon O'Hanlon
显示剩余2条评论

网页内容由stack overflow 提供, 点击上面的
可以查看英文原文,
原文链接