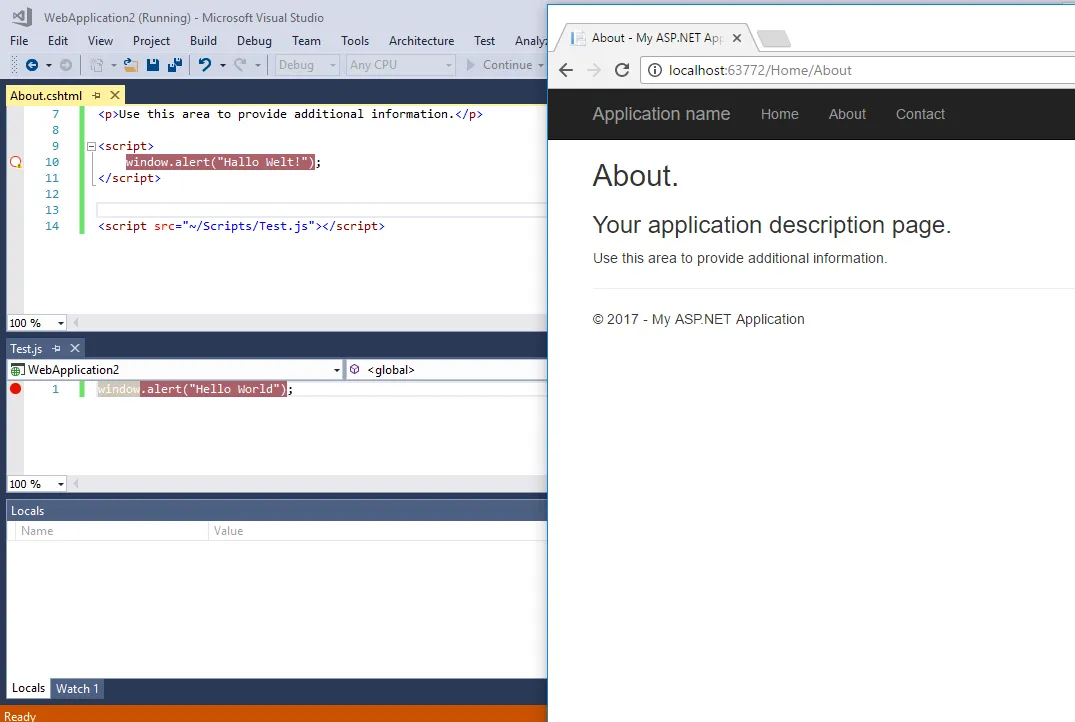
我刚刚安装了Visual Studio 2017。在启动ASP.NET MVC应用程序后,我收到消息说在Visual Studio中启用了Chrome调试。
但是我的Visual Studio断点不起作用。Razor代码上的断点似乎可以正常工作,但Javascript不行。断点没有完全变为红色。重新启动和重建都没有效果。
我有以下代码示例
@Html.Partial("_Test", Model.Test) // debugging works here

<script>
    var i = 1;
    console.log(i); // debugging does not work here or above
</script>

@section scripts {
    <script>
        var a = 11;
        console.log(a); // debugging does not work here or above
    </script>
}
我没有打开Chrome调试控制台,并且我已经在Visual Studio中勾选了选项(“启用JavaScript调试…”),该选项已启用。
根据这篇博客文章,我认为应该有效: https://blogs.msdn.microsoft.com/webdev/2016/11/21/client-side-debugging-of-asp-net-projects-in-google-chrome/
这里有什么遗漏吗?这可能是Visual Studio 2017中无法工作的问题吗?
我只有一个扩展程序,那就是Resharper,但我想这不是问题。